@HappyDolphin🐬 checks on #CollaborativeArtJourney
There is #collaborativeartjourney organised by @everlove and #whysocurious wonders who are the arty people and how their posts in the challenge are doing. So, @happydolphin extracted the data of the posts with #musicchallenge tag and the votes of these posts. Then exported the results into 2 Excel files and loaded it to Power BI. I just wanted a snapshot of the data to work with so I didn’t make Power BI query #steemsql database directly. Anyway, the query could take a long time.
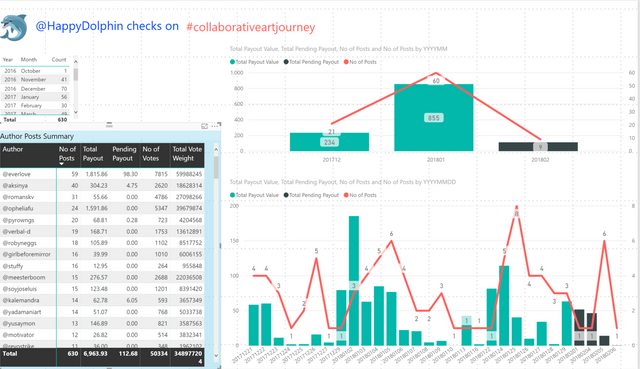
There were already 630 posts when I extracted yesterday. 60 posts were from last month.
Other than @everlove, the next highest number of post is @aksinya and I’m not surprise.
You can see from this where I sort the Author Summary by No. of Posts.

IMAGE LINK|图片链接: https://www.supload.com/BkFD7Iw8M
I didn’t see any day which is more popular for posting this.
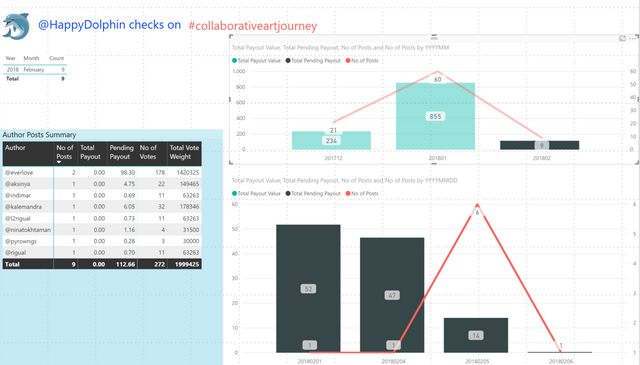
I decided to focus on just this partial month of February by clicking on the bar in chart for the month and I get this.

IMAGE LINK|图片链接: https://www.supload.com/BkFD7Iw8M
Other than the chart telling me 5th February was a busy day, the table of Author Summary Post also shows who posted in February some of whom you will recognise from the previous table. Of course, every posts would be still pending payout.
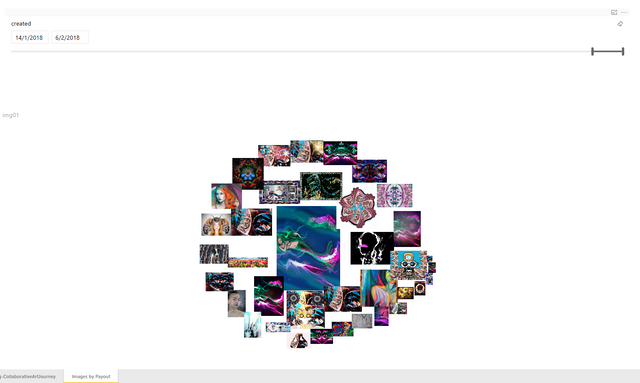
And I added a tab with the images from different authors with a date slicer which gives you an image grid of the images from posts that are within the selected date range.

IMAGE LINK|图片链接: https://www.supload.com/H1tg4IvIG
There you have it. @happydolphin is happy to look at the data and check out on #musicchallenge.
If you are interested in "touching" the Power BI report yourself, you can go to this link:
https://app.powerbi.com/view?r=eyJrIjoiY2I5MzEyZDEtMmM4ZS00ODkyLTk5NDgtZTEwMzU0NDAzZjdmIiwidCI6ImM1NzEzYTNiLWU1MTktNDIxMy1iNWUzLTQwMzRmN2E5ZTdiZiIsImMiOjEwfQ%3D%3D
Note: Don’t worry. You won't break the report but I can’t guarantee it will be there forever.
If you do go play with the report, a few things you can try are:
- Click on the header of the matrix table to see the data sort differently.
- Click on an author in the matrix table and see how the chart change to present for that author.
- Click on a month and see the data just for that month.
- Click on a column in the chart to see how the matrix table of author post summary changes

I am part of a Steemit Business Intelligence community. We all post under the tag #blockchainbi. If you have an analysis you would like carried out on Steemit data, please do contact me or any of the #blockchainbiteam and we will do our best to help you.
You can find #blockchainbi on discord https://discordapp.com/invite/JN7Yv7j

Note: Access to SteemSQL is currently provided at subscription fee of 10 SBD per month.
See this post from @arcange for more details:
SteemSQL is moving to a monthly subscription model

Hope you like it.
Don't forget to upvote.
Resteem if you like to share this 😎
Follow @happydolphin
 for more