Plan B introduced an updated model: bitcoin at $ 288,000 with a capitalization of $ 5.5 trillion
The Stock-to-Flow (S2F) model for Bitcoin was introduced by Plan B in March 2019.
The original model is a formula based on monthly S2F [reserve-to-gain] data and bitcoin price. Since the values are indexed in time order, this model is a time series model. This model has attracted the interest of quantitative analysts around the world, and many have confirmed the robustness of the relationship between S2F and the price of BTC.

This article reinforces the relevance of the original S2F model by ignoring timing and including additional assets (silver and gold) in what I call S2FX. It allows you to value various assets such as silver, gold and BTC by applying a common formula.
To begin with, I propose to consider the concept of phase transitions, thanks to which it is possible to look at BTC and S2F from a different angle. This concept serves as a clarification of the significance of the S2FX model.
Below is a description of the S2FX model, how it works and the meaning of the results.
Phase transitions
Phase transitions play an important role in understanding S2FX. As a result of phase transitions, substances acquire different properties. Transitions are often intermittent. Examples of phase transitions are:
water;
U.S. dollar;
bitcoin.
Water
Water is a classic example of phase transitions. Water can exist in four different phases (states): solid, liquid, gaseous and ionized. All this is water, but in each phase it has completely different properties.

U.S. dollar
Phase transitions can also be in the field of finance. For example, the US dollar has undergone three phase transitions:
Gold coin - one dollar = 371.25 grains of pure silver = 24 grains of gold;
A banknote backed with gold (“Payable in gold at the request of the bearer”);
Unsecured banknote ("This banknote is legal tender for all debts, public and private").
Although we continue to refer to this banknote as the “dollar”, its meaning at different stages is fundamentally different.

Bitcoin
The same is true for BTC. Nick Carter and Hasu, in their 2018 study, show how the perception of Bitcoin has changed over time.

These perceptions of Bitcoin by network users appear to be fairly continuous in this diagram. However, if we combine the attitude of the network participants to the asset with the main time milestones (and then with the S2F data and prices), they begin to be traced their similarity to certain phases with sharper transitions:
"Proof of Concept" -> after the publication of the Bitcoin whitepaper;
"Payments" -> after the parity of bitcoin and US dollar (1 BTC = $ 1);
"Digital Gold" -> after the first halving and the approach of the BTC price to the cost of an ounce of gold;
"Financial asset" -> after the second halving (overcoming the $ 1 billion per day transaction volume, legal certainty in Japan and Australia, CME and Bakkt futures markets).
These examples of phase transitions in water, USD and BTC open up new perspectives for BTC and S2F. It is important to consider the problem not only from the point of view of a continuous time series, but also to pay attention to phases and abrupt transitions. When developing the S2FX model, at each stage BTC is considered as a new asset with completely different properties. The next logical step is to identify and quantify BTC phase transitions.
S2F Model for Bitcoin and Other Assets (S2FX)
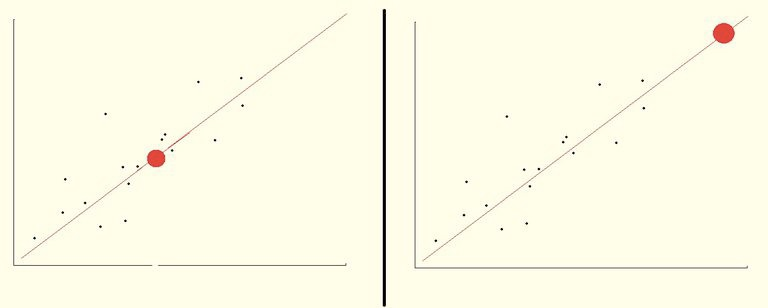
The chart below shows the monthly BTC S2F values and price data used in the original S2F model. Four distinct clusters are clearly visible here.

By minimizing the distances between monthly BTC data and clusters, you can quantify them. To quantify the four clusters, I use a genetic algorithm (absolute distance minimization). Future research may rely on various clustering algorithms, such as the k-nearest neighbors method).
Each of the four identified BTC clusters has a different S2F market value combination than the others. Each of these combinations seems to be consistent with halving and a change in perception of BTC:
BTC Proof of Concept (S2F 1.3 and $ 1M market value);
BTC Payments (S2F 3.3 and market value of $ 58 million);
BTC "E-Gold" (S2F 10.2 and a market value of $ 5.6 billion);
BTC "Financial asset" (S2F 25.1 and a market value of $ 114 billion).
Similar to water and the US dollar, these BTC clusters represent four different items, each with different characteristics. BTC as a “Proof of Concept” with S2F 1.3 and a market value of only $ 1 million is fundamentally different from BTC as a “Financial Asset” with S2F 25 and a market value of $ 114 billion.
Considering the phase transition of BTC clusters as different assets, it became possible to supplement the model with other assets, such as silver and gold. This allows you to build a real model for various assets. For silver and gold, I use stock and flow values from recent analysis by Ian Nuivenhuis and comparable December 2019 prices from TradingView:
Silver S2F 33.3 and a market value of $ 561 billion;
S2F 58.3 gold and a market value of $ 10.088 billion.

The graph shows four quantitative BTC clusters (plus the original monthly BTC data for context), silver and gold. They form a perfect straight line.
I use regression analysis to build my S2FX model. Note that the significant difference with the original S2F model is that I am using S2F data for silver and gold and market value data in regression analysis. The S2FX model shows a significant relationship between S2F and the market value of these six assets (low F, low p) with perfect compatibility (99.7% R2).
The S2FX model formula can be used to estimate the market value of the next BTC phase / cluster (BTC S2F will reach 56 in 2020-2024):
Market value = exp (12.7598) * 56 ^ 4.1167 = 5.5 trillion
This means that the price of BTC (including 19 million coins in circulation in 2020-2024) will be $ 288,000.
The target price for BTC is well above the $ 55,000 mark in the original study. Keep in mind that the S2FX model is a first step that has not yet been replicated and reviewed in detail by other researchers.
Note 1: Although the aggregate of the above six observations is not a conclusive indicator, I highly appreciate the results of the calculations based on the S2FX model.
Future research may focus on improving this model by adding additional assets. However, the S2F values of most assets are low (≤1) and therefore not of interest. On the other hand, the S2F of diamonds, for example, is high, but it is very difficult to build a valuation model for this asset (rough / cut, carats, difference in color and clarity, etc.).
Note 2: the S2FX model allows for interpolation, unlike the extrapolation in the original S2F model. The original S2F model's prediction is out of the data range used when it was created. The forecast of the new S2FX model falls within the range of data used.
Conclusion
This article reinforces the relevance of the original S2F model by ignoring the timing and including additional assets in the model. The S2FX model allows you to value various assets such as silver, gold and BTC by applying a common formula.
This article provides a description of phase transitions. Phase transitions provide an opportunity to look at BTC and S2F from a different angle. This is what led me to think about the S2FX model.
The S2FX model's formula is ideal for data (99.7% R2).
The S2FX model predicts the market value of the next phase / cluster of BTC (Bitcoin's S2F value will be 56 in 2020-2024) at $ 5.5 trillion. This means that the price of BTC (including 19 million coins in circulation in 2020-2024) will be $ 288,000.
Reinforcing what is known from the original S2F research, the S2FX model offers a fresh perspective on BTC's Phase 5 transition.