Bitcoin Cash Price Analysis: June 4
On May 12, the Bitcoin Cash price (BCH) reached a low of $306.5. An upward move ensued and on May 30, the price reached a high of $482.0. It has been decreasing since.

Bitcoin Cash Price (BCH): Trends and Highlights for June 4, 2019
- BCH/USD reached a top on May 30.
- It broke down from an ascending wedge on Jun 3.
- It is trading inside a long-term ascending channel.
- Significant bearish divergence is developing in the RSI and the MACD.
Ascending Wedge
On May 12, the Bitcoin Cash price (BCH) reached a low of $306.5. A rapid increase ensued. On May 16, the price made a high of $450.0.
Since then, it has been trading inside the ascending wedge outlined below:
On Jun 3, the price broke down from the wedge. It is not currently following a short-term trading pattern.
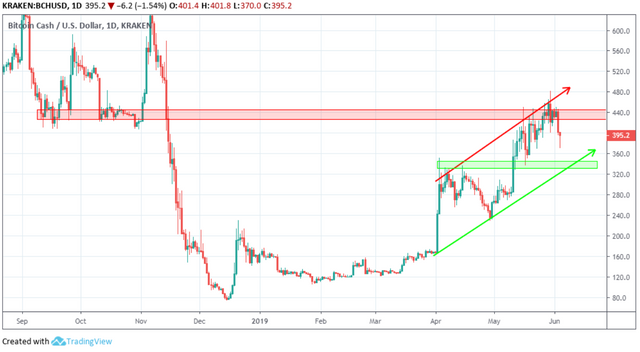
A look at a longer time-frame is required in order to give us a trading pattern.Ascending Channel
On Apr 2, the price reached a low of $167.1. A rapid upward move ensued. The price reached a high of $351.7 the next day.Since then, it has been trading inside the ascending channel outlined below:

At the time of writing, the price was trading in the middle of the channel.
In order to predict how long the decrease will last, we will analyze the price alongside the RSI and the MACD below:

As stated above, the Bitcoin Cash price (BCH) reached a high on Apr 3. Similarly, the RSI and the MACD did the same.
However, while the price has reached several higher highs, the RSI and the MACD have generated lower values.
This is known as bearish divergence and often precedes price decreases.
The level of divergence is very significant and occurring in both indicators. Furthermore, the MACD has made a bearish cross and is falling down. In the case of the RSI, the divergence is also present in longer time-frames.
The use of these indicators makes it likely that the Bitcoin Cash price will continue to decrease towards the support line.
Reversal Areas
One support and resistance areas for BCH/USD are traced below:

The closest support area is found near $330. It coincides with the support line of the channel. We believe that the price will soon reach this area. The lack of significant support between current prices and this area makes a rapid drop possible.
The closest resistance area is found near $440. It is a very significant area created by the lows of Sep and Oct 2018. Combined with the significant long-term divergence, this makes it very unlikely that the Bitcoin Cash price (BCH) will move above this area in the near future.
Posted from Bittabi Bittabi.com : https://bittabi.com/bitcoin-cash-price-analysis-june-4/