Bollinger Band indicator: what is %b?
A vast number of technical analysis (TA) indicators exist. One interesting choice in possible relation to the crypto space is John Bollinger's %b indicator.
In a previous article, Crypto Insider detailed Bollinger Bands® (B.B.), a charting indicator overlay developed by finance expert John Bollinger. Essentially, the three bands show where an asset's price is located in relation to relatively high or low ranges. These bands also indicate times of increased or decreased market volatility.
As stated on his website, after creating the bands that bear his name, John Bollinger created the %b indicator as an additional tool.
%b
According to the official Bollinger Bands website, "%b tells us where we are in relation to the Bollinger Bands. The position within the bands is calculated using an adaptation of the formula for Stochastics."
The website states %b can serve many purposes, such as spotting divergences and formations, as well as "the coding of trading systems using Bollinger Bands."
Additionally, "Indicators can be normalized with %b, eliminating fixed thresholds in the process. To do this plot 50-period or longer Bollinger Bands on an indicator and then calculate %b of the indicator," the website added.
Indicator levels
On TradingView.com, %b has dotted lines at levels of zero and one. In a video lecture on the MetaStock YouTube channel, Bollinger noted the indicator can move up past the dotted line at the one level when price is outside the upper Bollinger Band, and down below the zero line when market valuation is outside the lower band.
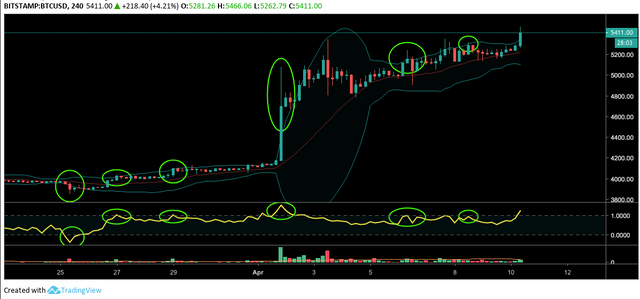
Image Courtesy: TradingView.com
Visible in the chart above, the dotted lines correlate with the Bollinger Band levels on the chart. Price hits the upper band as the indicator also tags the upper dotted line at a level of one. When price moves above the upper band, %b also can be seen above the higher dotted line. The same applies to the lower band and its relation to the dotted line at zero.
Divergence
Described above, one of the interesting possible use cases for %b can come in the form of divergences. At times, the indicator can appear to diverge in comparison to price action, leading to a possible change in price direction, similar to how some traders use the Relative Strength Index (RSI).
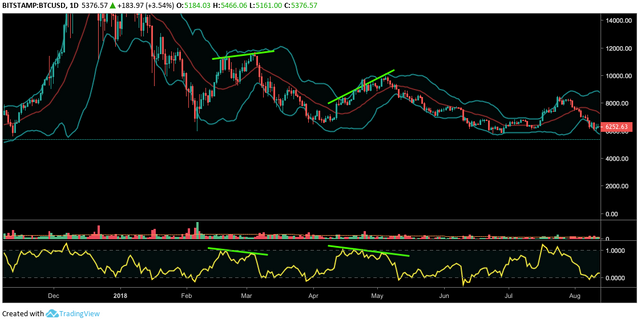
Image Courtesy: TradingView.com
It is important to note, however, that higher time frames can carry more significance in terms of price action. Additionally, it can be important to take multiple factors and indicators into consideration, instead of a single observation. Fakeouts and false signals also do occur as no indicator is correct all the time.
Patterns
In the MetaStock YouTube lecture, Bollinger showed the use of formations with %b. He pointed out a "w-bottom" on %b as it correlated with a similar structure in price, with price tagging the bottom Bollinger Band. Additionally, the financial expert pointed out divergence in the w-bottom seen on %b.
Bollinger also noted the occurrence of an uptrend after the w-bottom formation, with %b not traveling below its zero line on the indicator during the uptrend after said W formation.
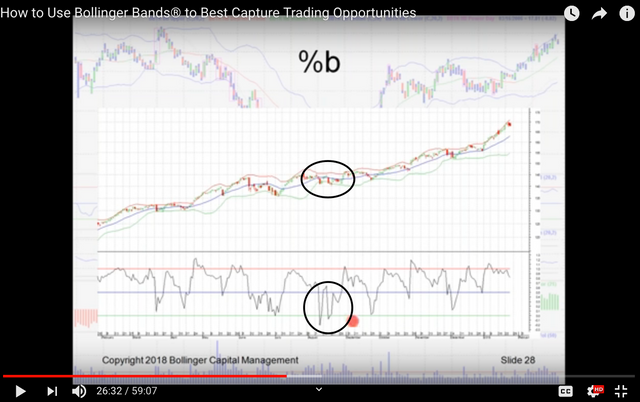
Image Courtesy: YouTube.com (MetaStock) *Black circles added for clarity
Speaking on the many additional use cases for %b, Bollinger said the indicator "is very useful in pattern recognition," as well as "in systems trading, and such like that." Although he added that he did not have enough time in the lecture to dive into all the details.
*Further research may be required by readers regarding %b, due to the indicator's uses and complexity.
*This article is based on the author's interpretation of the data, and includes opinions, speculations from the author and others, and is not in any way financial advice. Writing about price levels, charts, etc., is purely speculation, subject to speculatory bias. Nothing written is any kind of advice whatsoever. Proceed only at your own risk.
Read more:
-
Nathaniel Popper: Facebook crypto asset looks to VC firms for investment
- Securitizing the future of finance
- Are Coinbase pumps a thing of the past?
Originally posted on Crypto Insider : https://cryptoinsider.com/bollinger-band-indicator-what-is-b/