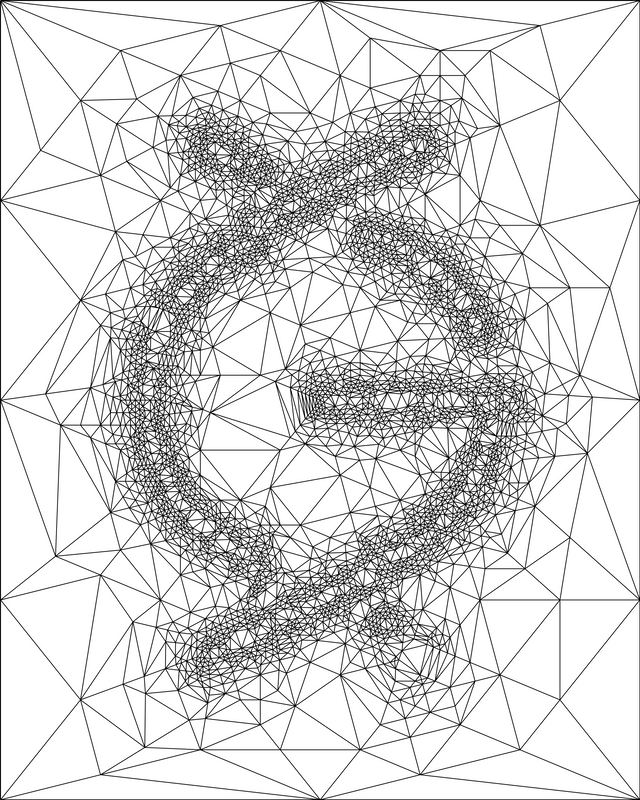
Adaptative mesh applied to the Gridcoin logo
Here is a mesh I computed in order to evoke the new Gridcoin logo
First, I decomposed the logo into elementary shapes like lines, circles and meeting points.
Then I computed the distance function to the global shape defined as the minimum of all the distances from those elementary shapes.
Then I ran a mesher which adapts to the metrics defined by that function.
Et voilà!

By Zipity.grc (Own work) [CC BY-SA 4.0], via Wikimedia Commons
The hardest part (beside writing the mesher) was to tweak half a dozen of coefficients in order to stress the 'active' locations -- the shape itself -- from the backgound by varying triangle density.
The result has T = 7202 triangles, and as you can count there are B = 12 border edges (and 12 border vertices obviously).
Fun fact : this is enough to compute E the total number of edges!
Indeed, as
for any triangular mesh, we have E = 10809 edges. And now, since the Euler characteristic is 1 for a planar mesh
so V = 3608 vertices.
(edit: hints for a proof here)
Nice work! I have no idea how you achieved this - anything mathematics goes way over my head :) - so this is like some kind of wizardry to me! Is the final result capable of being exported in a vector format? It might be fun to play around with for interesting artistic applications :)
Thanks @joshoeah! You can't say your logo has nothing mathematical in it! Lines and circles, that's all there is ;-)
About the format, as a matter of fact I used an SVG version for producing the png.
Here it is .
By the way, this is @originalworks
Speaking of applications, the inital use of a mesh is to simulate fluid dynamics equations on it. I'm thinking of a gif where the logo moves like a liquid or a fire.
Wow fluid dynamics with this image sounds incredible cool! Would love to see this.
Indeed, I would like to see a little candle light haloing and bouncing along the logo. The density of the mesh could be used to represent the more stable part of the fluid. Or the coldest part depending on the choice of equations we decide to make. Physicists, help !
Ah wow, that's amazing! Had no idea that's what you could do with something like this - so over my head, but I look forward to seeing the results :)
As a physicist, I can appreciate this! :D
Physics rule! Would you help me run some fluid simulation on this ?
Perhaps, but I'm not a fluid dynamicist :P Not sure how much work that would involve. Maybe there are some existing packages out there that can simulate Navier-Stokes on a custom mesh. Not the kind of thing I'd want to code from scratch..!
I don't understand a bit of it but it sounds scientific ;-)
Lol ! Metrics is like the scale on a map. Except it is not written once on the map, it is defined differently for every point on the map . This kind of mesh is just a series of equilateral triangles, except they are drawn with respect to a special metrics : the metrics (the scale) which zooms according to the distance to the shape of the logo. I hope I could give the general idea :/
Instead of trying to understand it i'll just gaze in awe.. 😵