One Year ARDR Price Chart Analysis - Cryptocurrency Technical Analysis Review
There are so many unscientific trading methods - one is wise to hold them all suspect. Even better, one should never trade on a recommendation from someone else.
For this reason, I have a written plan for trading cryptocurrencies and all of my videos and commentaries on the crypto price charts - are my trading journal as I practice implementing my plan. Review of the year of technical analysis in each of the cryptocurrency markets, is an excellent way to identify and categorize the mistakes and successes - and to determine the precise moments where my plan has the highest risk of being wrong... but more... to determine the moments when I am not trading according to my plan.
Profit Results
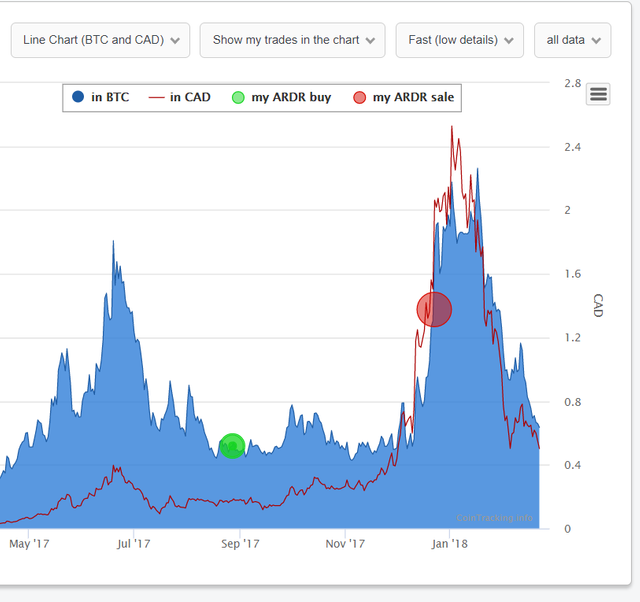
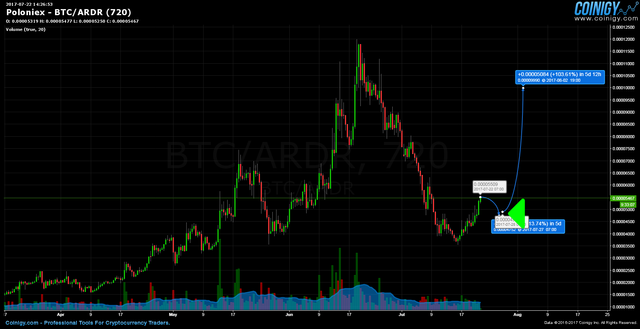
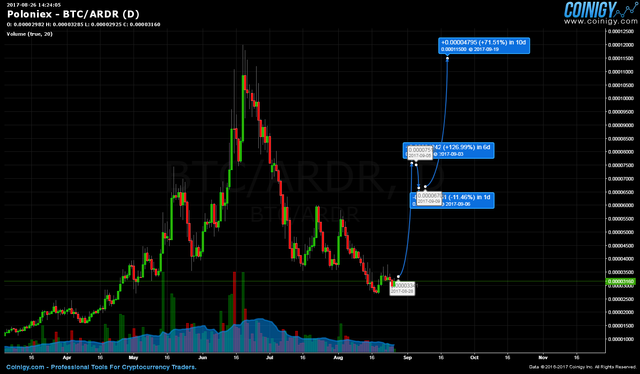
Starting with Trading Profits in ARDR, this chart shows the buy in green and the sell in red - only a part of the position was sold, the original investment was taken as profit and the remaining coins are held for the very long term. This trade followed the 'Popcorn Trading Method' and required almost no time to manage. After the investment was purchased, profit target stop exits were placed, and no attention was paid to the market until after profits were automatically taken as prices rose sharply in December 2017.
Average Buy Price: 0.00003241
BTC Average Sell Price: 0.00008598 BTC
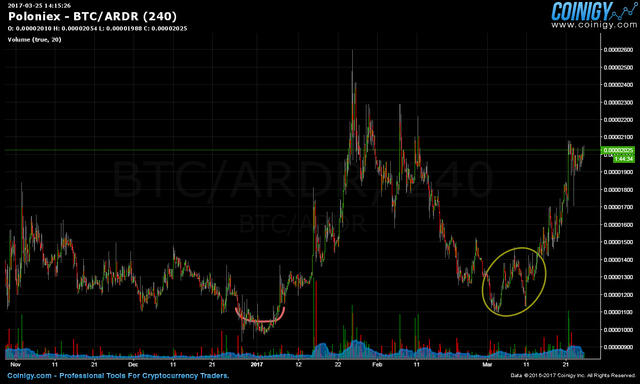
March 2017
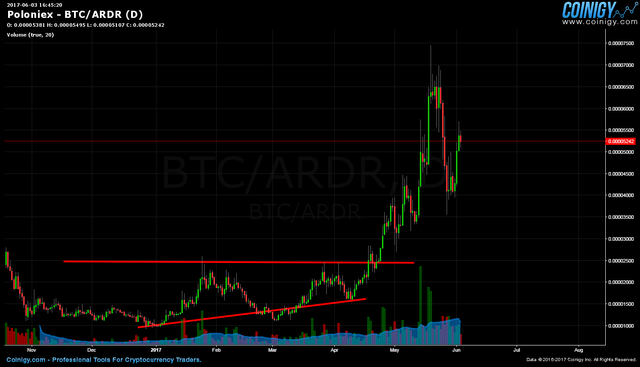
March 25 2017, the 1-2-3 bottom formation is evident early in March of 2017.
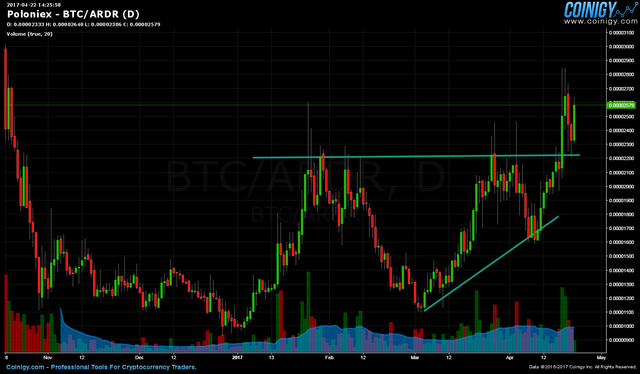
April 2017
April 22 2017 price of ARDR has broken above a large ascending triangle wedge. bullish
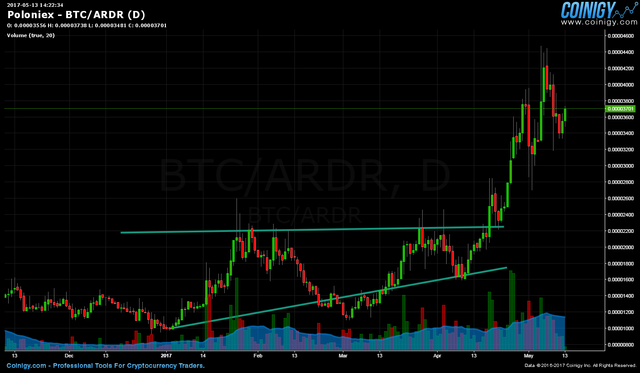
May 2017
May of 2017 sees the strong break above the triangle wedge formation identified the month prior - keeping an eye on the long term charts is a key tool for success.
June 2017
In June of 2017 we can see a common pattern in uptrending cryptos - that of the deep spike reversal. This event is so common, we have a specific trading strategy to anticipate these bot driven events.
July 2017
in July of 2017 ARDR prices had seen their highest and the top formation gives anticipation of lower prices ahead.
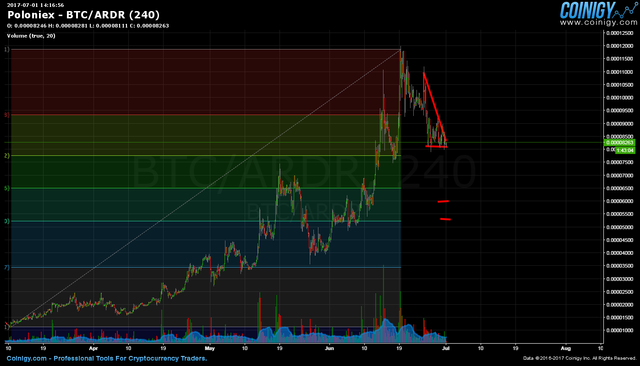
Later in July, the early predictions of price crash turned out to be accurate. Now anticipation a strong return of the bull in an ongoing uptrend that did not full materialize for six months after this
August 2017
Early August -
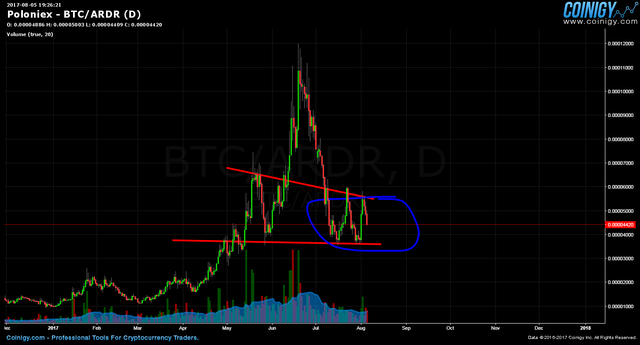
Later in August -
late august 2017 new lows, a consolidation in ARDR prices at historical levels at the same time bitcoin was making a potential top formation - anticipation was strong for a return of the bull - that did not come for several months
September 2017
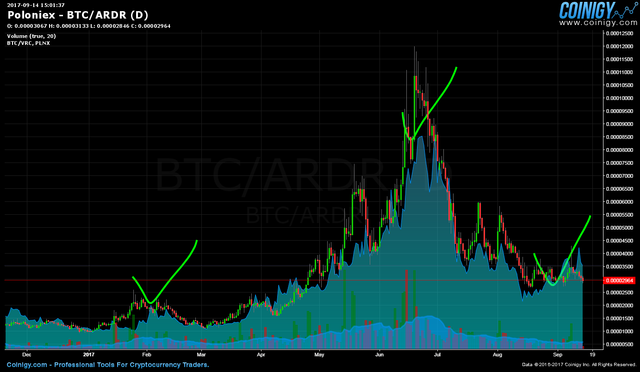
September 2017 still reading the charts looking for a return of the bull - this was a key moment where all the Altcoins diverged. As bitcoin (the blue shaded) prices began a massive bull run all of the altcoins went on a several month long down trend.
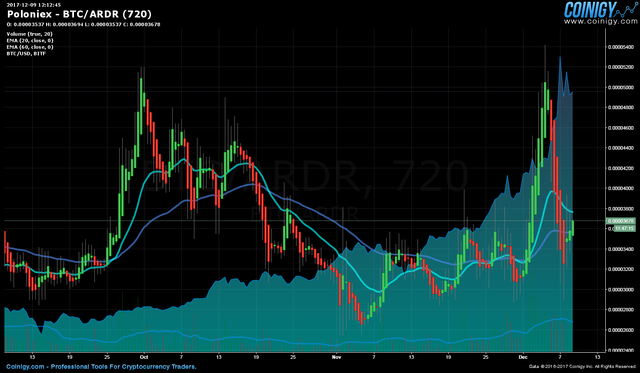
October 2017
the end of october 2017, watching for the time when altcoins start their uptrend vs the price of bitcoin, potential 1-2-3 bottom with clear trendline of support, watching for when the bull returns...
Some additional thoughts about trading ARDR, published on the DigitalCurrencyTraders forum, and republished here:
Lets take a look at the long term chart of ARDR over the 1 year view with daily bars... and let's also check out the ARDR coin market cap.
We are looking at the coin market cap over a 1 year view, and we can see that in the middle of August that divergence happened here as well.
Now I want to zoom in to the 1 month view and see what's happening is there a crossover - so yes in late October the green is definitely approaching the yellow the yellow is the price in Bitcoin the green is the market cap or the price in u.s. dollar
Wow that is pretty interesting to see that there is a crossover of these two lines right now in the one month view for this chart
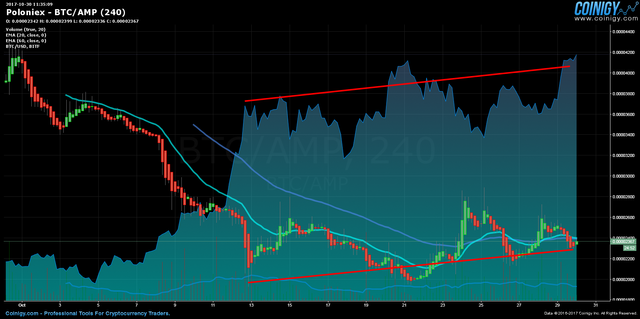
And we also saw them approaching and having crossed over from October 8th to the 12th in the other chart for AMP
Again, back here in August is when the divergence happened.
Looking at the 1 year price chart and of course I probably don't have to show you the one two three bottom formations very much anymore... but he here's the breakout right here there's the buy signal
You certainly would have used your rule number one to say okay it didn't prove me correct and start the trend yet... but,,, had you bought in earlier and put your stop-loss below these historical levels you'd be well sitting in there not a problem at all to let it fluctuate along like this. It's pretty normal for a market to do this from out of the bottom formation - it is seldom a clean thing when prices create a potential bottom formation pattern...
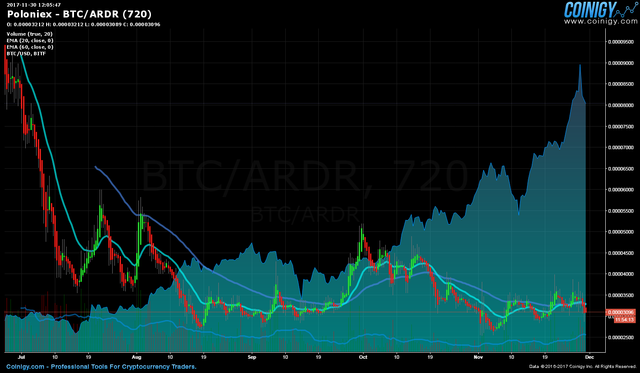
In the three month view, ARDR technical analysis is still in great shape here.
A prudent thing to do is to look at the moving averages in the the three month view (12 hour bars) and see that the moving averages did cross over earlier and they are crossing over again now, which, in this pattern, is bearish for this market.
To have these moving averages cross and cross again is important.
And so for my own part this market is interesting because of the change in the momentum of the market - but - until the moving averages give a green light - it's still not time to buy in yet.
For the prudent crypto investor, it's still time to sit back...
November 2017
The october consolidation proves a fakeout breakout and prices drop to create a new #1 point in early November - almost a double bottom with the August low.
December 2017
Early December 2017 - ARDR is showing pre-pump patterns and a strong bottom formation.
February 2018
After a strong move in December, prices of ARDR topped in January and prices faded lower along with most of the alts. This price chart shows a potential path of future prices in 2018, anticipating a period of accumulation before the a more substantial and steady bull market takes over all the cryptocurrencies.
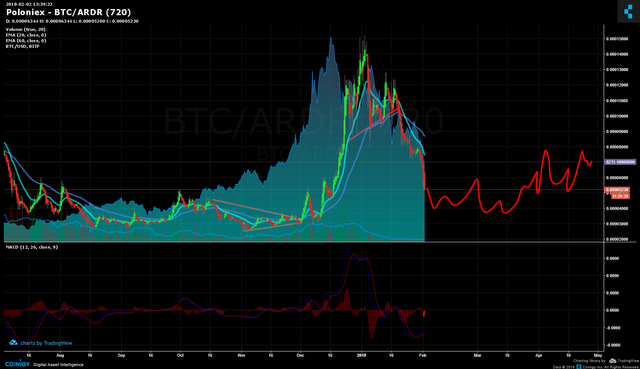
The 1 year chart of ARDR shows prices are now at historical lows - and time to be watching for the trend change.
When we zoom into the three month view, the impending bottom is getting more clear. The trendline may be broken already, but the 1-2-3 bottom is not in place and the 3 month EMA crossover has not occurred.
Still a bit more time.