Apple Price Technical Analysis - Bearish Bat Complete, Time to Sell
Apple's price has been trending upwards for nearly two months and we have seen a nice rally to the upside. Well, nothing lasts forever and a bearish bat pattern has completed and price is running into fibonacci resistance. So what do we do in this situation??
Well, after watching price action carefully and witnessing resistance hold, we take out a short position.
Below I will explain the reasons for taking a short position on Apple. In the upcoming days or weeks I will analyze my position until my targets are reached or until my live trade is stopped out.
Why Go Short?
I am a harmonic trader, so the number one reason for me to short Apple is the completion of the bearish bat pattern. This is one of my favorite harmonic patterns to trade because of its accuracy and the small stop loss. See below for the definition as explained by the creator Scott Carney.
The Bat Pattern™, is a precise harmonic pattern™ discovered by Scott Carney in 2001
The pattern incorporates the 0.886XA retracement, as the defining element in the Potential Reversal Zone (PRZ).
The B point retracement must be less than a 0.618, preferably a 0.50 or 0.382 of the XA leg. The Bat utilizes a minimum 1.618BC projection.
In addition, the AB=CD pattern™ within the Bat pattern™ is extended and usually requires a 1.27 AB=CD calculation. It is an incredibly accurate pattern and requires a smaller stop loss than most patterns.
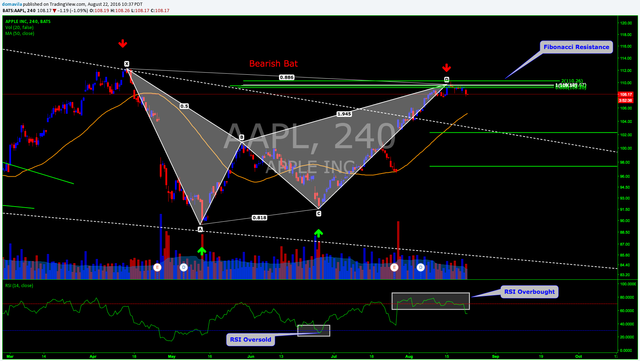
Our bearish bat meets all the criteria mentioned above and serves as an excellent example of this pattern. Once price hit the 0.886 retracement of the XA leg price stalled. Now, if this bat pattern plays out, we can expect to see a reversal in price action. Remember, although the bat is a accurate pattern, nothing is certain in trading and these patterns can and do fail. There is no such thing as a perfect system.
View Image
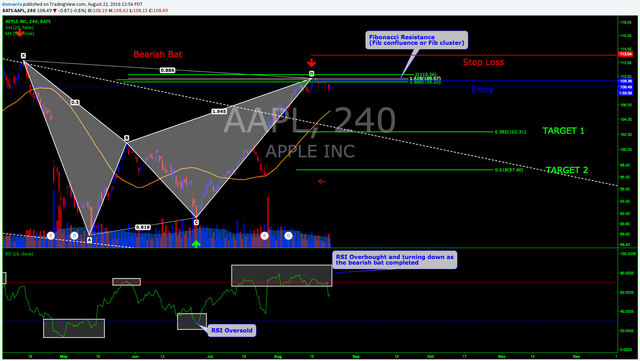
Another reason for shorting Apple was the Fibonacci resistance I encountered at the 0.886 retracement of the XA leg. I drew multiple fibonacci retracements, extensions and projections (please see chart above), and many of them converged in the same area. This is called fibonacci confluence, or a fibonacci price cluster. This method is outlined in the book "Fibonacci Trading" by Carolyn Boroden AKA the Fibonacci Queen. The fibonacci cluster provides us with an excellent resistance level that happens to coincide with the completion of the bat. This gives us another case to short and a good area to place our stops above.
RSI
View Image
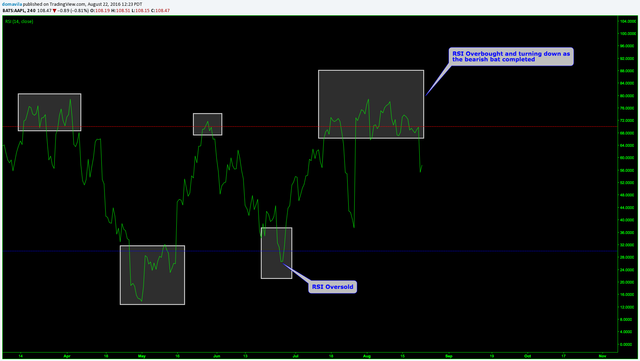
RSI was in the overbought area at the completion of the bearish bat pattern, this is critical for the timing of the pattern and is a great signal for us to take out a short position as soon as RSI starts turning down and heading south.
RSI currently sits at 58.
Position
Opened on August 18th, 2016
Entry: $109.35
Stop loss: $112 & $113
Target 1: $102.31
Target 2: $97.40
Conclusion
After a nice rally I think Apple is due for a correction. The completion of the bearish bat, along with the area of fib resistance and overbought RSI give me plenty of reasons to go short. Lets see how this trade plays out!
Please watch this live trade play out here. Please hit the play button for the live price.
@domavila you are speaking my language. Some equities talk, I like it. I'm with you on Apple. The stock is no longer a growth story, it's going through what Microsoft did years ago. I do not expect Apple stock to go much of anywhere in the coming years. Facebook has taken the growth crown from Apple. One of my early posts was about that.
Glad to see you agree. I'll have to check out that earlier post of yours!!
UPDATE
View Image
It looks like the Fibonacci resistance is holding up and the bears are pushing price lower. RSI is turning down and we are seeing a nice reaction to the downside. Please follow and watch this blog for current updates and analysis on Apple.
You can watch my live trade here on TradingView.
UPDATE 2
View Image
We are having a nice harmonic reaction to the downside after the completion of the Bearish Bat.
I will continue my analysis in a future post and will post the link here.
In the meantime, you can watch the live trade here on TradingView.