A colorful experiment with plant pigments
In my previous post, I remarked on the beauty of plants with respect to the diversity of flower color, and the genetic basis of cultivar differences in anthocyanin pigmentation in petunia. For plant biology teachers this can be used to perform a relatively simple experiment to stimulate interest of students in plant biology and biochemistry. The following is a simple experiment I conducted with students in a Plant Physiology course. 10 individual flowers of petunia were collected from my garden in the summer of 2013 and each flower was placed in a vial containing 5 mL of methanol.
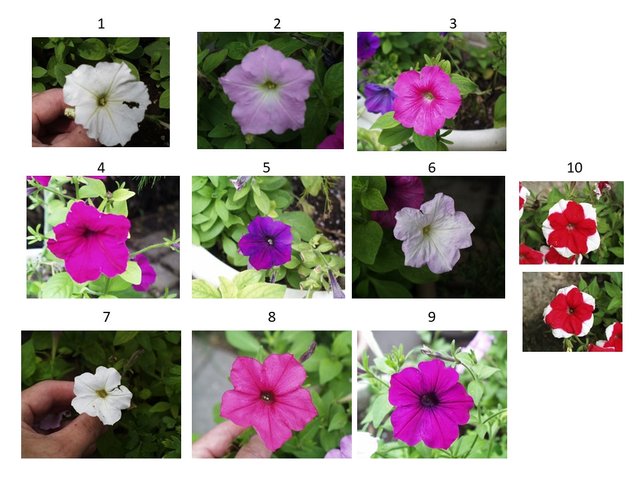
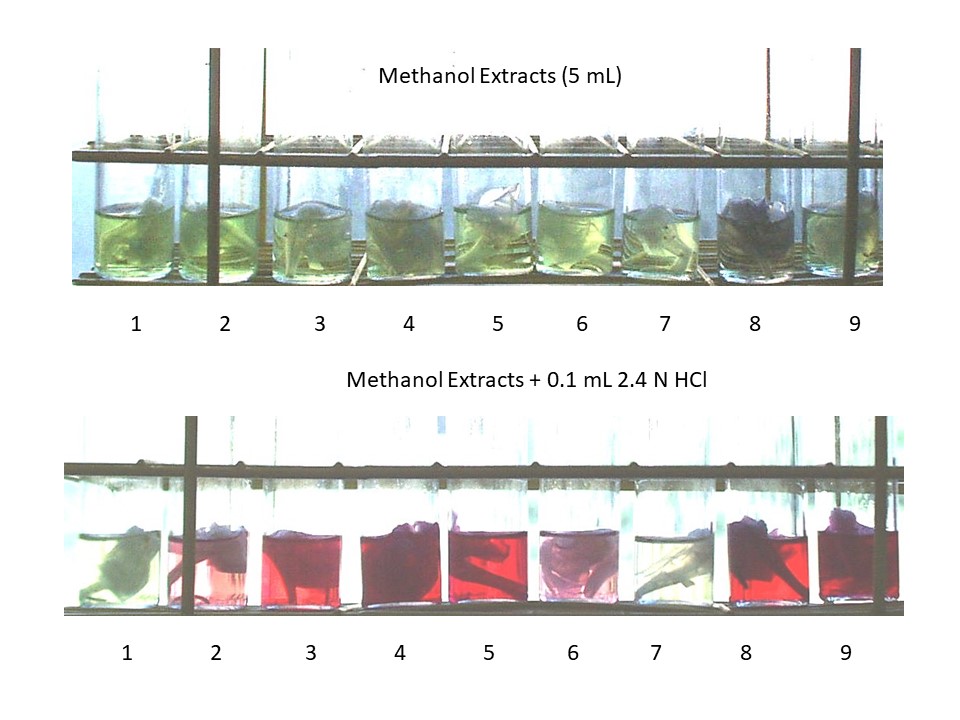
Vials were stored at 4 degrees C for 2 days in the dark. Extracts of flowers 1 - 9 were then photographed (see upper panel of image immediately below). Note that most of the anthocyanin color has faded from each of the flower extracts; only the green chlorophyll from the flower sepals is visible at this stage. However, when 0.1 mL of 2.4 N HCl is added, anthocyanin color is restored in the extracts of the non-white flowers (see lower panel of the image immediately below). This clearly demonstrates that anthocyanins are pH indicators (like litmus paper). White flowers (1 and 7) appear to lack anthocyanins, and therefore probably carry mutations in genes encoding an enzyme (or enzymes) at very early steps in the anthocyanin biosynthesis pathway.
Aliquots of 10 uL of each of the acidified methanol extracts of flowers 1 - 9 were then applied to a thin layer chromatography (TLC) plate (an aluminum-backed plate coated with silica gel and a fluorescent indicator). The plate was developed in a TLC tank containing the solvent n-butanol: acetic acid: water (60:20:20 v:v:v). After development the plate was removed from the TLC tank, the solvent front was scored with a pencil, and the plate was allowed to dry in a fume hood. Subsequently the plate was scanned under visible light with a flat-bed scanner under two brightness/contrast settings (upper left and upper right panels of image below). The plate was also photographed under ultraviolet (UV) light (upper middle panel of the image below). Finally, 0.5 mL aliquots of each of the acidified methanolic extracts were diluted into 2.5 mL of 50 mM sodium phosphate buffers of different pH in test tubes and photographed from above (lower panel of image below).
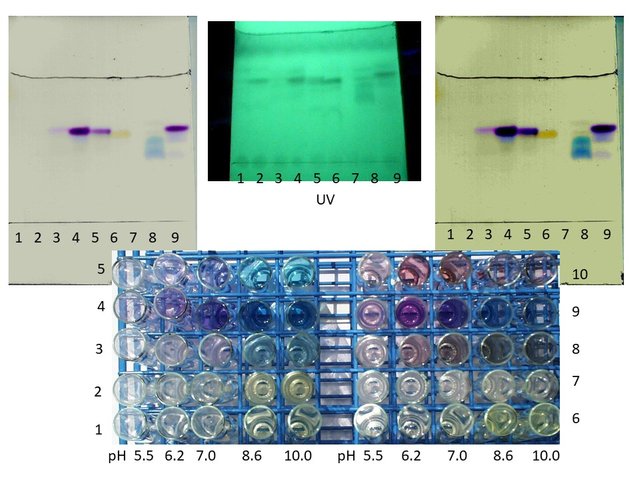
The TLC plates show that many of the visible anthocyanin pigments also absorb UV light and therefore appear as darkened bands on a green background on the plate when viewed under UV light. Some flowers clearly contain multiple pigments with different mobilities on the TLC plate (e.g. flowers 8 and 9). The color response to pH in the range 5.5 to 10.0 is subtly different for each flower. Surprisingly the pigment of flower 6 appears yellow on the TLC plate. It is well recognized that the cellular pH of the living flower petals has a significant impact upon how the flower appears to the naked eye.
For the purpose of demonstrating the pH indicator properties of anthocyanins, and that different cultivars have different anthocyanin pigments which can be easily separated in the laboratory, it is not essential to know the exact chemical identities of each of these pigments.