BITCOIN WEEKLY ANALYSIS
Key Points
Bitcoin price recoveries faced sellers towards $2550 against the US Dollar, and slowly declined lower.
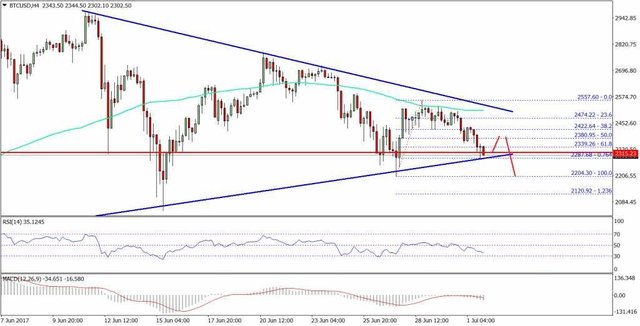
There is a major contracting triangle pattern with support at $2300 forming on the 4-hours chart of BTC/USD (data feed from SimpleFX).
A break and close below $2300 could ignite further declines towards the $2120 level.
Bitcoin price is approaching a major break below $2300 against the US Dollar, and it looks like BTC/USD may continue to struggle below $2400.

Bitcoin Price Support
It was mostly a tough week for Bitcoin price below the $2500 level against the US Dollar. The price attempted recoveries on a couple of occasions above the $2400 and $2500 levels, but failed. There was a downside move initiated below $2500 and the price followed a bearish pattern. It has already moved below the 50% Fib retracement level of the last wave from the $2204 low to $2557 high.
There is a monster contracting triangle pattern with support at $2300 forming on the 4-hours chart of BTC/USD. It may play a major role in the near term for the next move, which could be mostly below $2300. On the upside, the triangle resistance trend line at $2470 is a key barrier. It also coincides with the 100 simple moving average (H4) at $2475. Since the price is already below the 61.8% Fib retracement level of the last wave from the $2204 low to $2557 high, it could retest $224.
If there is a break and close below the triangle support at $2300, there are chances of a move towards $2100. The overall trend is bearish for BTC/USD and it may trade lower towards $2100-2000 in the short term.
Looking at the technical indicators:
4-hours MACD – The MACD is gaining pace in the bearish zone.
4-hours RSI (Relative Strength Index) – The RSI is well below the 50 level and heading lower.
Major Support Level – $2300
Major Resistance Level – $2450
Charts courtesy – SimpleFX
Disclaimer: The information contained
Good Analysis
Technical Analysis is key for financial markets prediction
Great post. Thanks for sharing.