Cryptocurrency prices analysis and forecast – 4 December 2018

BTC/USD
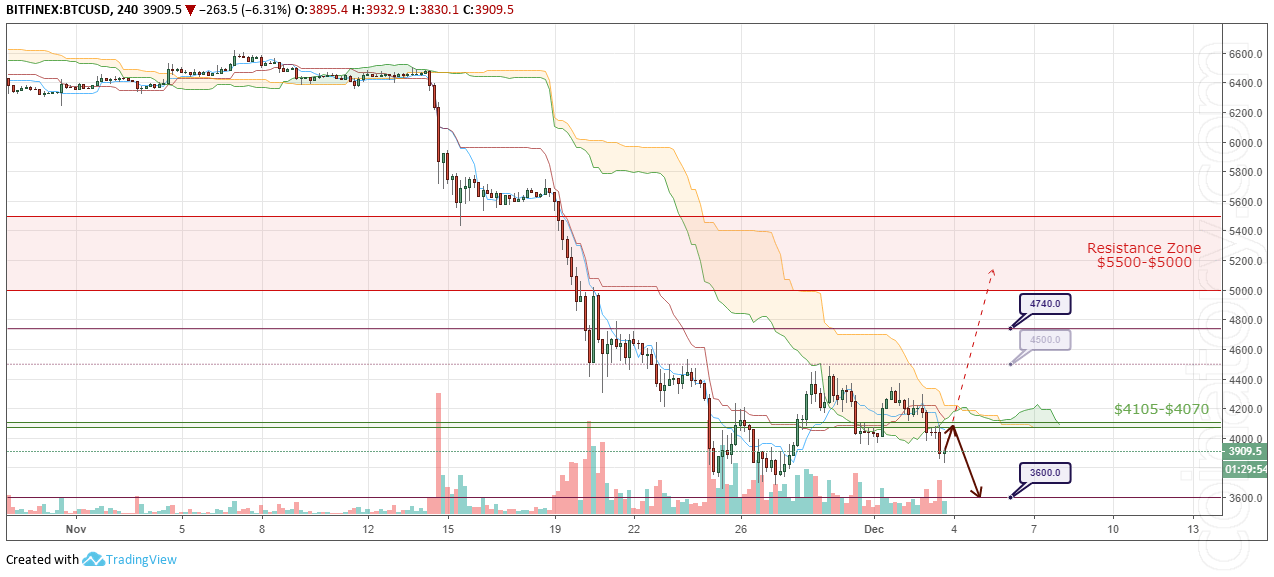
BTC/USD is being traded at $3,909 and continues to be traded as part of a correctional flat. The last month of the current year has begun. Crypto world expects events from it compared to similar periods of the past. However, the situation is completely different this time. The past years, Bitcoin ended on a wave of interest and a surge in volatility. The year 2019 will begin against the background of the Great Depression and reflections on the utopian idea of the massive use of crypto actives. The exit from the boundaries of the global corridor will show how exactly events will develop in the last weeks of 2018. Unless of course, the coin wants to stay in its cosy flat. Its upper level is $5,500. The lower limit is a local bottom at $3,600. Despite the fact that these boundaries are quite wide, any event in the cryptocurrency world can knock out the price for these boundaries in just 1-3 days. A confident breakdown of any of these boundaries is a serious bid for the future.
BTC/USD Forecast and analytics 4 December 2018
As part of the forecast for December 4, we can expect a continuation of the correction within the boundaries of the trading range of $4,500 - $3,600. The signal area has expanded a little but continues to remain fairly narrow, $4,105 - $4,070. This is a dynamic zone of the "balance" of the asset price for the next day. Departing from it higher or lower, the price will tend to return to this value. For now, it is lower and it is likely that the price will test it, and then go to the lower area of the trading range $3,800 - $3,600. It is also worth noting that in the area of $4,037 - $4,025 a large accumulation of limit sell orders has appeared. This is slightly below the technical "balance" zone. The zone is dynamic. Therefore, most likely, if there is a return to the price to it, the zone will be adjusted to the area where limit orders are now located. Such a coincidence may give the price additional acceleration. It can quickly go to $3,000.
An alternative would be to continue the development of a full upward correction. To start with, the price will need to break through $4,500 and go to the first goal of $4,740. Further, we can expect growth in the resistance zone of $5,500- $5,000.
ETH/USD
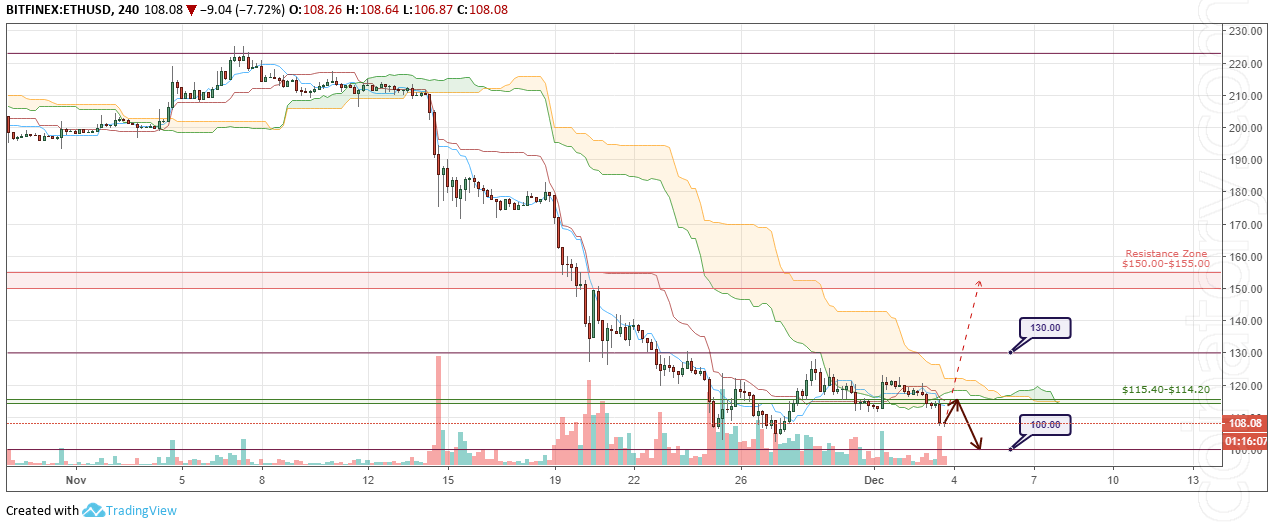
ETH/USD is being traded at $108.08 and continues to be traded as part of a correctional flat. This coin is in the top three main outsiders on the basis of trading results for November 2018. Undoubtedly, all cryptocurrencies survived one of the worst months in history. To emphasize how bearish the market was last month, it can be noted that there are only 9 digital currencies left with a market capitalization in excess of $ 1B. At the end of October 2018, there were 14. But among the general downward dynamics, there are three outsiders, whose losses were higher than the rest. Ethereum takes the "honourable" third place with a rate of 42.7% negative. Only Bitcoin Cash (59.6%) and EOS (44.8%) concede the coin. At current levels, Ethereum has a market capitalization of around $12.1B. This makes the coin the third largest cryptocurrency in the world. However, one should not forget that since the beginning of the year Ethereum has lost a whopping 85.4%. The statistics are extremely depressing. Now Ethereum continues to record a long-term price reduction, although there were no specific reasons for a sale. The strong dependence of the coin on the general negative sentiment in the market will most likely continue to move it down.
ETH/USD Forecast and analytics 4 December 2018
As part of the forecast for December 4, we can expect the continuation of the correction within the limits of the trading range of $130.00 - $100.00. The signal area has expanded a bit but continues to remain fairly narrow. $115.40 - $114.20. This is a dynamic zone of the "balance" of the asset price for the next day. Departing from it higher or lower, the price will tend to return to this value. Currently, it is lower and it is likely that the price will test it, and then go to the lower area of the shopping range $105.00 - $100.00.
An alternative would be to continue the development of a full upward correction. To start with, the price will need to break through $130.00 and gain a foothold above. Then we can expect growth in the resistance zone of $150.00 - $155.00.
XRP/USD
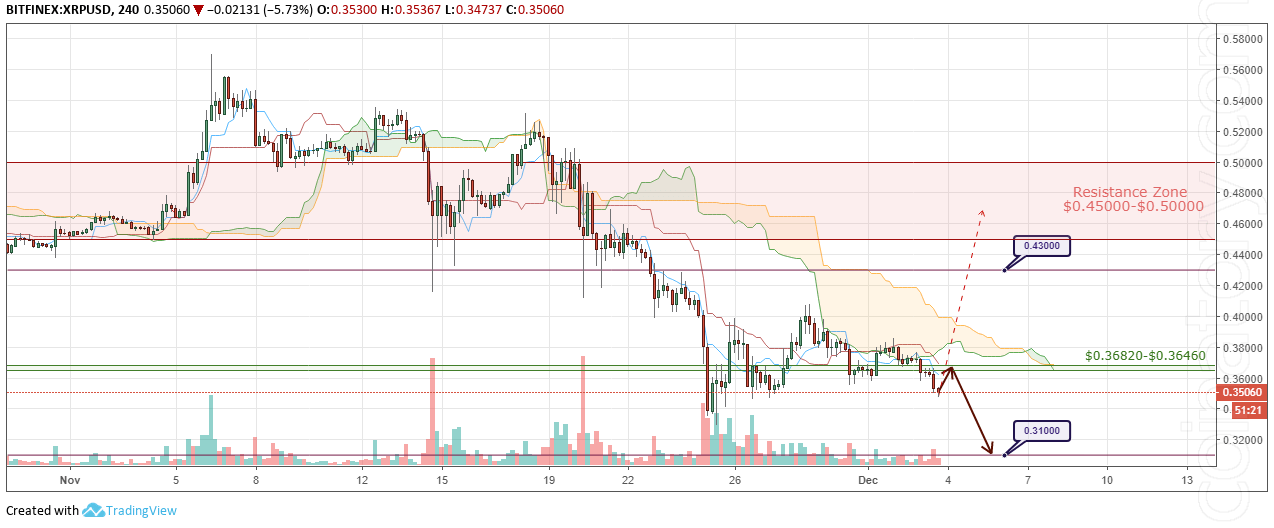
XRP/USD is being traded at $0.35060 and continues to be traded as part of a correctional flat. After breaking through the first range of $0.38650 - $0.35500 down, the quotes made it clear that now there is no place for bulls on the market. This applies even to the previously formed short-term upward movement. The coin is completely unprepared for growth. It will take more time to change investor risk attitudes. At the moment, the dynamics of the coin continues to be tied to general market trends. We look forward to the development of the "domino" effect and a breakthrough the following, broader savings $0.40770 - $0.34590 and $0.43000 - $0.32890. After that, the boundaries of the upcoming flat may be formed. At the moment, its time frame is $0.43000 - $0.33000.
XRP/USD Forecast and analytics 4 December 2018
As part of the forecast for December 4, we can expect the continuation of the correction within the trading range of $0.40500 - $0.33000. The signal area has expanded slightly but continues to remain fairly narrow. $0.36820 - $0.36460. This is a dynamic zone of the "balance" of the asset price for the next day. Departing from it higher or lower, the price will tend to return to this value. Currently, it is lower and it is likely that the price will test it, and then go to the lower area of the trading range $0.34000 - $0.33000.
An alternative would be to continue the development of a full upward correction. To start with, the price will need to break through $0.40500 and go to the first goal of $0.43000. Further, we can expect growth in the resistance zone of $0.50000 - $0.45000.
XMR/USD
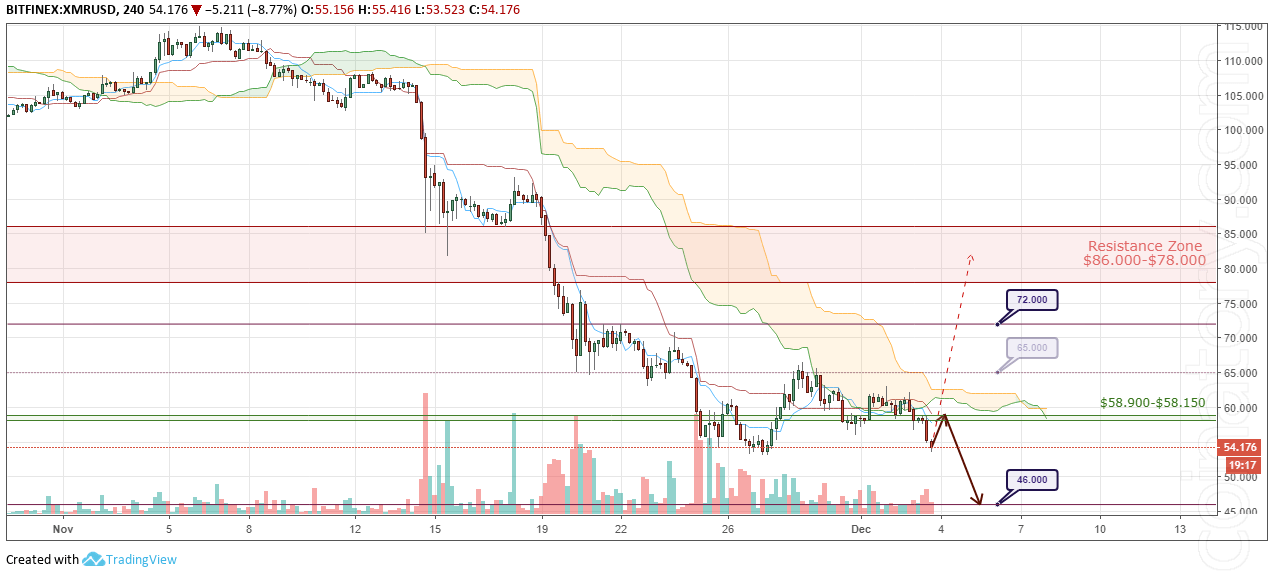
XMR/USD is being traded at $54.133 and continues to be traded as part of a corrective flat. At the end of November 2018, this coin left the list of cryptocurrencies with a market capitalization that exceeds $1B. Monero did it with 4 more coins - TRON, IOTA, Dash and NEM. An annoying fact, but not critical. Still, Monero is No. 1 coin in its rather narrow class of complete anonymity. Therefore, it will not be surprising at all that it will perfectly survive all general market excitements, depressions and falls.
XMR/USD Forecast and analytics 4 December 2018
As part of the forecast for December 4, we can expect the continuation of the correction within the range of $65.000 - $50.000. The signal area has expanded a bit but continues to remain fairly narrow. $58.900 - $58.150. This is a dynamic zone of the "balance" of the asset price for the next day. Departing from it higher or lower, the price will tend to return to this value. Currently, it is lower and it is likely that the price will test it, and then go to the lower area of the $54.000 - $53.000 trading range. Since now the price is very close to the minimum of the whole fall, it is likely that it will be updated soon. The estimated fall target is $46.000 support. Perhaps after this, a wider trading range of $72.000 - $46.000 will be formed.
An alternative would be to continue the development of a full upward correction. To start with, the price will need to break through $65.000 and go to the first goal of $72.000. Then we can expect growth in the resistance zone of $86.000 - $78.000.
Posted from my blog with SteemPress : https://coinatory.com/2018/12/03/cryptocurrency-prices-analysis-and-forecast-4-december-2018/