Cryptocurrency prices analysis and forecast – 3 Deсember 2018

BTC/USD
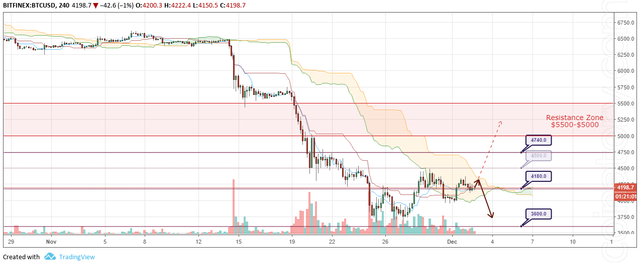
BTC/USD is being traded at $4,198 and continues to stay within the correction. In November, the price of the coin fell to a whopping 37%. This was the worst monthly figure since 2011. At the moment, the coin is being traded on solid volumes. This suggests that the market is relatively involved in spot trading. This reduces the likelihood of strong volatility that appears in the case with low volumes. Now market participants are preparing for the beginning of 2019 and are actively gaining positions. The news background promises that the first quarter of 2019 will be exciting. So, in January it is planned to launch the Bakkt trading platform from the Intercontinental Exchange. Bakkt’s bitcoin futures differ from those already existing by their physical calculations. This means that after the expiration of the contract, customers will receive Bitcoin directly instead of its cash equivalent. Nasdaq also plans to open a Bitcoin futures market in the first quarter of 2019. The rest of the current year, the coin is likely to hold either within the flat or fall even lower, from where growth will be more promising.
BTC/USD Forecast and analytics 3 December 2018
As part of the forecast for December 3, we can expect the continuation of the correction within the limits of the trading range of $4,500 - $3,600. The signal area is now very narrow, so let's mark it with the price level of $4,180. This is the level of the "balance" of the asset price for the next day. The price can both move up and down from it. At is practically on it now, so, before quotes go to the lower area of the $3,800 - $3,600 trading range, a slight upward rebound is possible.
An alternative would be the continuation of the development of a full upward correction. To start with, the price will need to break through $4,500 and go to the first goal of $4,740. We can expect growth in the resistance zone of $5,500- $5,000 later on.
ETH/USD
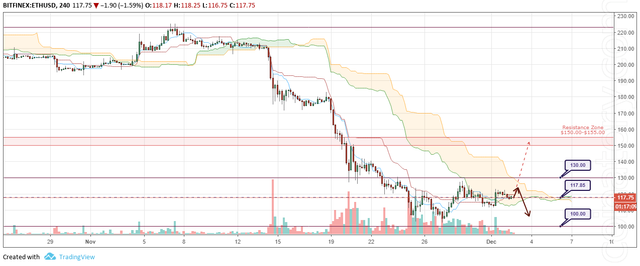
ETH/USD is being traded at $117.75 and is in a rather narrow accumulation. Technical analysis says that bears have not finished sales yet. Therefore, the current accumulation may be exactly bearish. This may lead the price below $100.00 and form the lower bound of the flat in the region of $89.00 - $83.70. This area is not fully formed yet. The time limits are $130.00 - $100.00. Do not forget about the level of $99.00. There is a strong dynamic support. It is unlikely to freely miss the market below this level. Therefore, there is a possibility of forming the lower border of the trade corridor in this particular area.
ETH/USD Forecast and analytics 3 December 2018
As part of the forecast for December 3, we can expect the continuation of the formation of the current accumulation. The signal area is now very narrow, so let's mark it with the price level of $117.85. This is the level of the "balance" of the asset price for the next day. The price can move both up and down. Currently, the price is practically on this level and a slight upward rebound is possible before the quotes go to the lower area of the local trading range of $105.00 - $100.00.
An alternative would be the continuation of the development of a full upward correction. To start with, the price will need to break through $130.00 and gain a foothold above this level. We can expect growth in the resistance zone of $150.00 - $155.00 after that.
XRP/USD
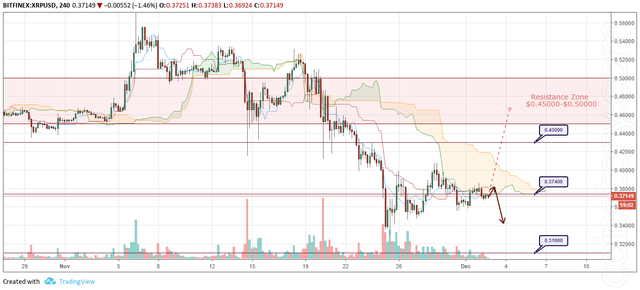
XRP/USD is being traded at $0.37149 in a rather narrow accumulation. Over the past few days, a very narrow accumulation has formed. Its range is $0.38650 - $0.35500. It is inside of the second broader accumulation of $0.40770 - $0.34590. And the second accumulation is inside of an even larger $0.43000 - $0.32890 accumulation. A breakthrough of the current narrow range will lead to a domino effect and a break in the same direction of the two larger ranges. As a result, we get either a continuation of the upward correction or a fall to new lows. After that, the boundaries of the upcoming flat will be formed. At the moment, its temporal boundaries are $0.43000 - $0.33000.
XRP/USD Forecast and analytics 3 December 2018
As part of the forecast for December 3, we can expect the continuation of the formation of the current accumulation. The signal area is very narrow, so we mark it with a price level of $0.37400. This is the zone of "balance" of the asset price for the next day. The price will tend to return to this value. As the price is lower now, there is the probability that the price will return to it again. The quotes are likely to go to the lower area of the local trading range of $0.34500 - $0.33500.
An alternative would be the continuation of the development of a full upward correction. To start with, the price will need to break through $0.40500 and go to the first goal of $0.43000. We can expect growth in the resistance zone of $0.50000 - $0.45000 later on.
XMR/USD
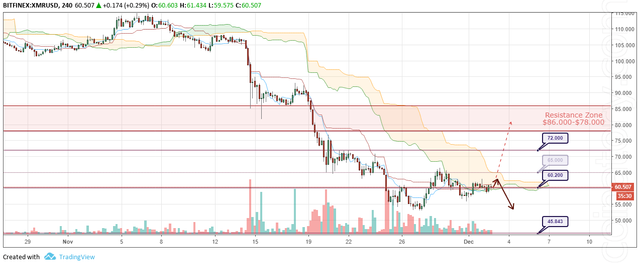
XMR/USD is being traded at $60.507 in a rather narrow accumulation. This range of $63.100 - $56.000 will be broken soon. One of the market postulates says: "The movement will continue rather than change." Therefore, the continuation of the bearish trend is in priority. Moreover, the effect of their actions is much greater. So bears continue to hold their positions. Since this coin has repeatedly shown itself to be a harbinger of the future movement of the entire market, it must be closely watched. It is possible that this time the coin will be the first to show which way for further movements to expect. The nearest strong support level is at $46.000. Perhaps the price will find support at higher values. The current boundaries of the temporary trading range are $65.000 - $54.000. In the future, it can expand to the levels of $72.000 - $46.000.
XMR/USD Forecast and analytics 3 December 2018
As part of the forecast for December 3, we can expect the continuation of the formation of the current accumulation. Resolving the situation is likely not to take long. The signal area is very narrow, so we mark it with a price level of $60.200. This is the level of the "balance" of the asset price for the next day. The price can both go up or down. For now, the price is practically on it, therefore a slight upward rebound is possible before quotes go to the lower area of the local trading range of $54.000 - $53.000.
An alternative would be to continue the development of a full upward correction. To start with, the price will need to break through $65.000 and go to the first goal of $72.000. We can expect growth to the resistance zone of $86.000 - $78.000 later on.
Posted from my blog with SteemPress : https://coinatory.com/2018/12/02/cryptocurrency-prices-analysis-and-forecast-3-de%d1%81ember-2018/