Cryptocurrency prices analysis and forecast – 20 October 2018

BTC/USD
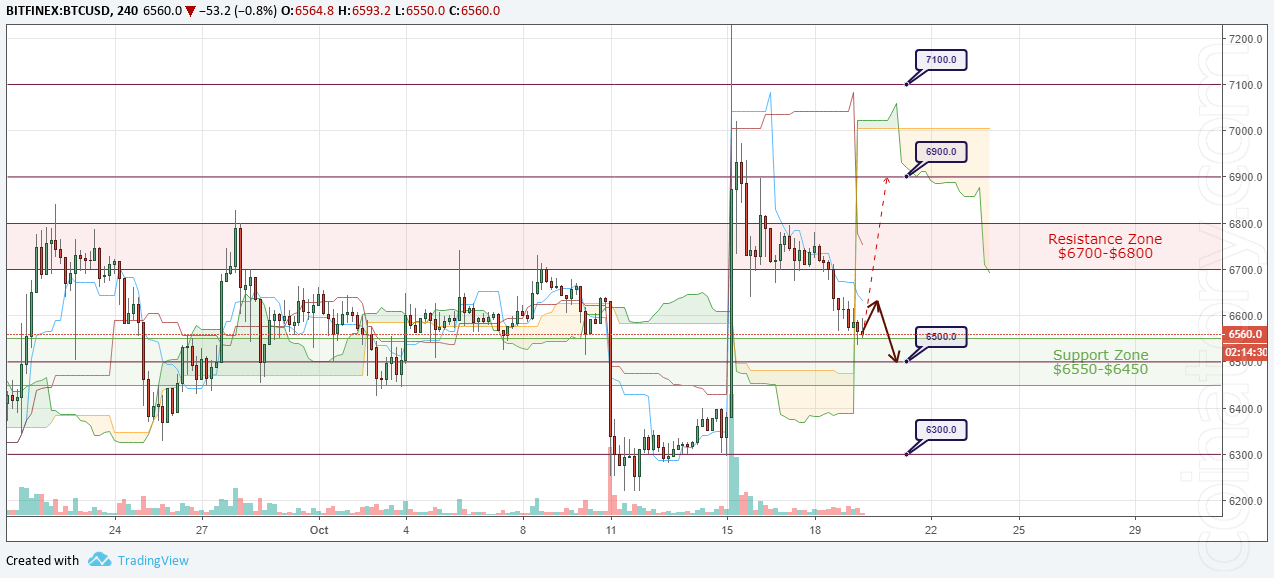
BTC/USD is being traded at $6,560 and continues to decline. After the expected fall to $6,500, the price has stabilized a bit. On the technical analysis side, the fourth day is trading along the resistance line of the triangle, level D1. We are witnessing phenomenally low volatility compared to last year. This allows the price for an incredibly long time to remain inside a contracting triangle, with a bottom edge of $6,000 and downward resistance. Already at the end of next week, the downward resistance will cross the support line. Technically, markets will have to make a choice: will support become the basis for long-term growth, or will it eventually change its status to a resistance line.
BTC/USD Forecast and analytics 20 October 2018
As part of the forecast for October 20, we can expect a quiet lateral movement along the support level of $6,550. If at the weekend we still see at least some significant volatility, the price may go up and test the area of the signal lines of the Ichimoku Kinko Hyo cloud - $6,630. After which, a further decline is likely to follow, to $6,500 - $6,450. Below this area is a zone of low interest, so when it breaks down, the price will very quickly fall to $6,300.
Cancellation of the downward movement will be a strong impulse growth and breakdown of the resistance zone, in order to break through the upper boundary of the resistance zone of $6,800 and gain a foothold above the level of $6,900. Only after that, we can expect growth to $7,000.
ETH/USD
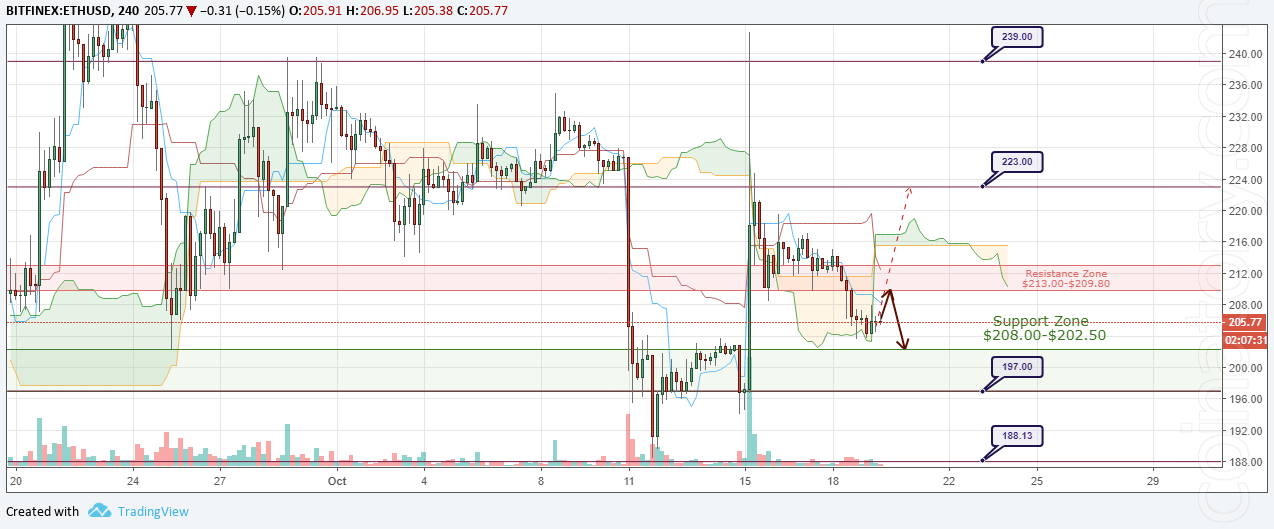
ETH/USD is being traded at $205.77 and continues to be in the process of correction. The coin following Bitcoin and gradually decreases to support $190.00. On the technical analysis side, a bullish convergence in MACD has been formed. This indicates that the decline will not be long and, most likely, a bounce is coming from the level of $190.00. But considering the worst dynamics over the last 2-3 months just for this coin, it is possible that technical analysis will not come true and the price will still go to lower levels, up to $180.00, in the medium term.
ETH/USD Forecast and analytics 20 October 2018
As part of the forecast for October 20, we can expect a corrective sideways movement. After the end of the movement to the side, that can last all the weekend, we can wait for the continuation of the decline, with the prospect of breaking through the lower boundary of the support zone at $202.50 and going down to the level of $197.00. If the price quickly reaches these goals, then with a high probability it will update the minimums of $194.00 and $188.00.
The abolition of the reduction will be an impulse growth, with the price fixing above the resistance level of $223.00. This will pave the way for the price to update highs in the $239.00 area.
XRP/USD
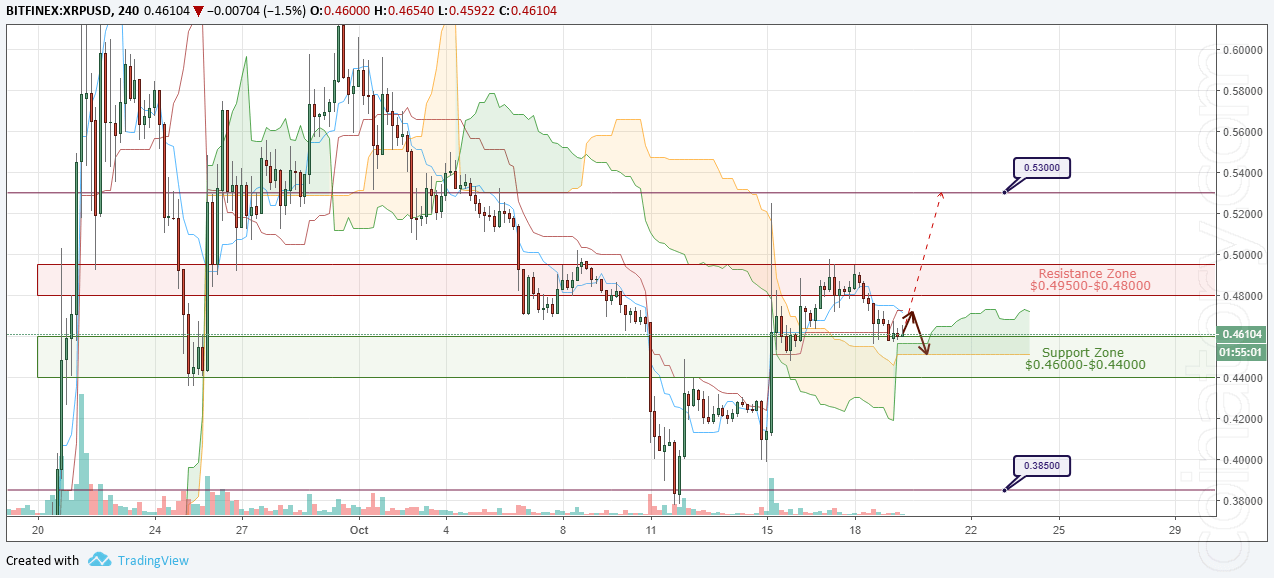
XRP/USD is being traded at $0.46104 and continues the corrective movement. Despite the positive news agenda, the coin did not show growth and consolidated at $0.46100. The reason for this was probably the proximity of the weekend and the news that the Head of Information Security Sujay Jaladi leaving the company.
XRP/USD Forecast and analytics 20 October 2018
As part of the forecast for October 20, we can expect a continuation of the corrective decline, in order to test the level of the lower boundary of the Ichimoku Kinko Hyo Cloud at $0.45000. If there is activity on the market, it is possible that the price will slightly roll back up to the signal lines of the Ichimoku Kinko Hyo Cloud at $0.47250 and higher to the resistance zone, after which the decline will resume or go to aside until the end of the weekend. If we see the momentum and rapid drop in quotes, then the price may fall to the minimum of the entire current correction of $0.44750 and test the lower boundary of the support zone.
Cancellation of this will be continued growth, in order to update the peak of $0.52500 and gain a foothold above the level of $0.53000. This will open the prospect of further development of the upward movement to $0.55100.
XMR/USD
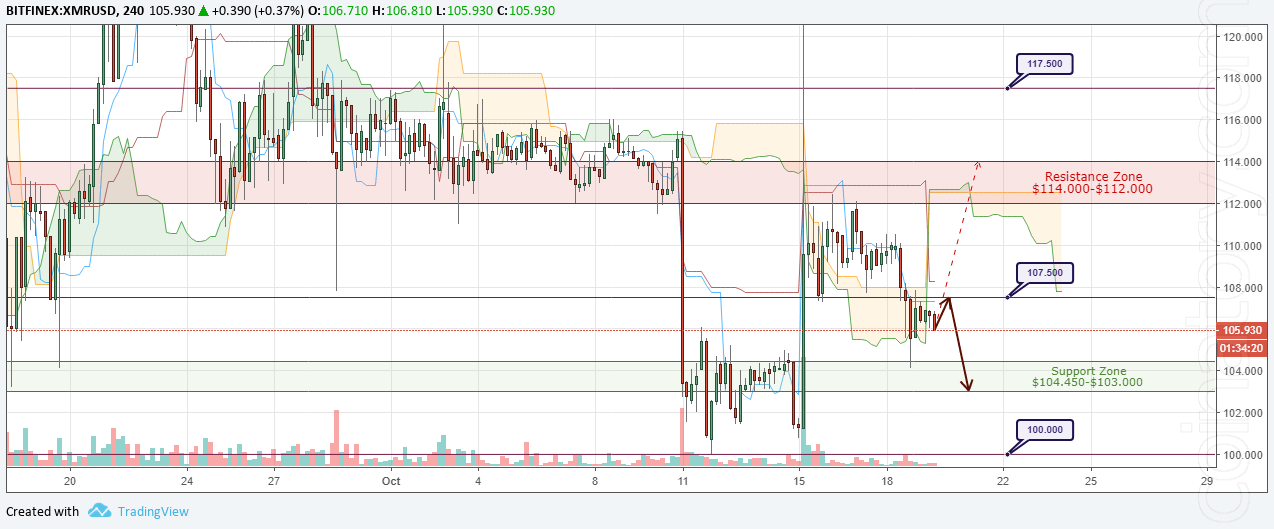
XMR/USD is being traded at $105.930 and continues to be in a corrective decline. In a pulse fall yesterday, the price tested the upper levels of the support zone and returned to the level of $107.500. Yesterday showed that buyers do not have the strength to push the price up, so we will see a continuation of the fall and update yesterday's minimum in the coming days. If the weekend is calm, then a further fall will resume early next week.
XMR/USD Forecast and analytics 20 October 2018
As part of the forecast for October 20, we can expect the continuation of the downward movement. Since the market usually behaves calmly at the weekend, the price may get stuck in the sideways movement or re-test the level of $107.500. After that, we will probably see a bounce, which will be an additional signal in favor of the fact that the quotes will go lower into the support zone of $104.000 - $103.000. Whether the price drops to $100.000 will be seen by the nature of the breakdown level of $103.000, if one happens.
Cancellation of the reduction will be the resumption of growth, in order to break through the upper resistance level of $114.000. Fixing the price above this level will open her further path to $117.500.
Posted from my blog with SteemPress : https://coinatory.com/2018/10/20/cryptocurrency-prices-analysis-and-forecast-20-october-2018/