Analysis: Bitcoin,Ripple,Cardano, Ethereum , Bitcoin Cash Price's Technical Analysis for 02/02/2018
Bitcoin Price Key Highlights
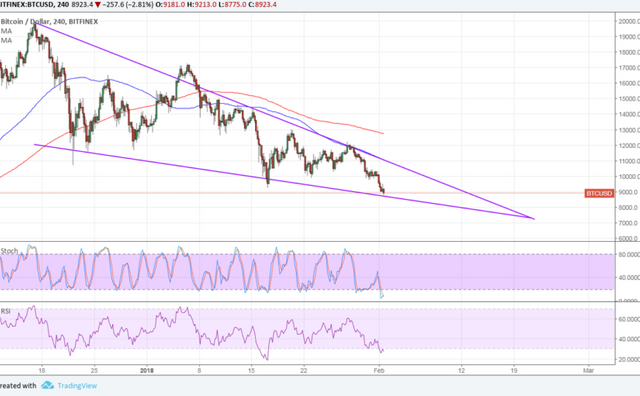
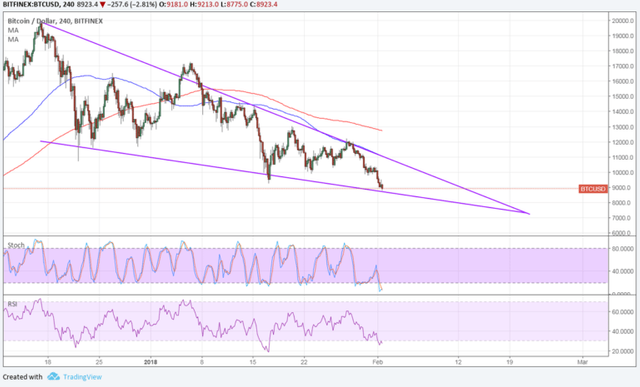
Bitcoin price went on another leg lower after breaking below a short-term triangle consolidation pattern.
Price is now testing another potential support at the bottom of its falling wedge pattern visible on the 4-hour time frame.
Price could bounce off this area and make another test of the wedge resistance around the $10,000 area of interest.
Bitcoin price can’t quite catch a break as it suffered another selloff to the $9,000 handle.
Technical Indicators Signals
The 100 SMA is still below the longer-term 200 SMA to indicate that the path of least resistance is to the downside. In other words, the selloff is more likely to continue than to reverse.
In addition, the gap between the moving averages is widening to reflect stronger selling pressure, possibly leading to a wedge breakdown. Note that this chart pattern spans $9,000 to $19,000 so the resulting breakout could be of the same height.
Stochastic is indicating oversold conditions, though, which means that bears are tired and could let bulls take over bitcoin price action. RSI is also ready to pull up from the oversold level to signal a pickup in buying momentum
Market Factors
Not even dollar weakness was enough to keep a lid on BTCUSD losses recently as negative sentiment for the cryptocurrency industry is prevailing. The lack of any positive updates is convincing more and more investors to liquidate their holdings, thereby exacerbating the selloff.
Analyst say that the increased scrutiny from regulators is still to blame for the tumble, especially since the CFTC announced plans to beef up its bitcoin futures review process. According to Chairman Giancarlo:
“The CFTC’s current product self-certification framework is consistent with public policy that encourages market-driven innovation that has made America’s listed futures markets the envy of the world. Whatever the market impact of bitcoin futures, I hope it is not to compromise the product self-certification process that has served so well for so long”.
This could involve setting “exchange large trader reporting thresholds at five bitcoins or less” and entering into “information sharing agreements with spot market platforms to allow access to trade and trader data.”

Key Highlights
Ripple price tumbled sharply and moved below the $1.0000 support against the US dollar.
There is a crucial bearish trend line forming with resistance at $1.0200 on the hourly chart of the XRP/USD pair (data source from SimpleFx).
The pair is likely to extend declines and it could even break below the $0.7500 support in the near term.
Ripple price is under immense pressure against the US Dollar and Bitcoin. XRP/USD is likely to accelerate declines below the $0.7500 support level.
Ripple Price Decline
There was the start to a new downside wave yesterday from the $1.1500 high in Ripple price against the US Dollar. The price tumbled and moved below the $1.0000 and $0.9000 support levels. To initiate the downside move, there was a break below a contracting triangle with support at $1.0600 on the hourly chart of the XRP/USD pair. It traded close to the $0.8000 level and formed a low at $0.8038.
It is currently attempting a correction from $0.8500. An initial resistance is around the 23.6% Fib retracement level of the last decline from the $1.0814 high to $0.8038 low. There are many hurdles on the upside around the $0.9000. The most important resistance is at $0.9750. It was a support earlier and now it could prevent gains above $1.0000. An intermediate resistance is the 50% Fib retracement level of the last decline from the $1.0814 high to $0.8038 low at $0.9420.
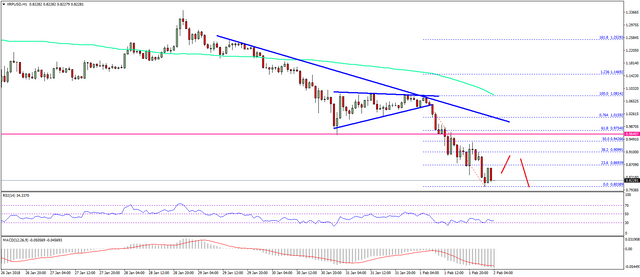
Clearly, the price is under a lot of pressure below $1.0000. It seems like it could even break the $0.8030 swing low. The next major support is around the $0.7500 level. If the current pressure remains intact, the price may even break the $0.7500 level.
Looking at the technical indicators:
Hourly MACD – The MACD for XRP/USD is currently moving heavily in the bearish zone.
Hourly RSI (Relative Strength Index) – The RSI for XRP/USD is moving lower and is well below 40.
Major Support Level – $0.7500
Major Resistance Level – $0.9500

Key Highlights
ADA price faced a lot of sellers and moved below the $0.4000 support against the US Dollar (tethered).
There is a declining channel forming with current resistance at $0.3950 on the hourly chart of ADA/USD (data feed via Bittrex).
The pair is likely to decline further and it could even break the $0.3500 support area in the near term.
Cardano price is trading in a bearish zone against the US Dollar and Bitcoin. ADA/USD may extend the current decline below the $0.3500 support area.
Cardano Price Decline
There was a nasty downtrend initiated in ADA price from well above the $0.6000 level against the US Dollar. The price faced a lot of sellers and it recently moved below the $0.5000 and $0.4000 support levels. The most important move was a break of the $0.4600 support area. It has opened the doors for more declines and the price is now trading well below the $0.4000 level.
The recent low was $0.3602 and the pair is currently poised for further declines. An initial resistance on the upside is around the 23.6% Fib retracement level of the last drop from the $0.5200 high to $0.3602 low. There is also a declining channel forming with current resistance at $0.3950 on the hourly chart of ADA/USD. However, the most important resistance is around the $0.4400 level. It is the 50% Fib retracement level of the last drop from the $0.5200 high to $0.3602 low. Above $0.4400, the previous support at $0.4600 may now act as a crucial barrier for more gains.
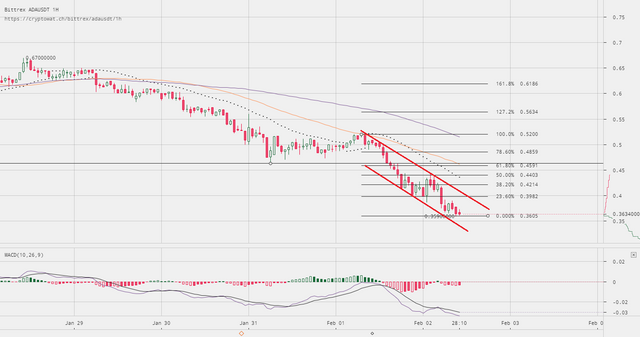
On the downside, the price may easily break the recent low of $0.3600. The next break could be below the $0.3500 level. Any further declines could take the price towards the $0.3000 level.
Hourly MACD – The MACD is gaining pace in the bearish zone.
Hourly RSI – The RSI is now placed near the oversold levels.
Major Support Level – $0.3500
Major Resistance Level – $0.4400
.jpg)
Key Highlights
ETH price started a new downside wave and moved below the $1,000 support against the US Dollar.
There was a break below a connecting bullish trend line with support at $1,120 on the hourly chart of ETH/USD (data feed via SimpleFX).
The pair is now trading well below the $1,000 level and it has moved into the bearish zone.
Ethereum price made a U-turn against the US Dollar and traded higher against Bitcoin. ETH/USD is likely to trade further lower with resistance at $1,025.
Ethereum Price Resistance
There was a sudden increase in selling pressure on ETH price, which took it below the $1,000 support against the US Dollar. The downside move was initiated from the $1,150 swing high and the price moved below the $1,100 and $1,025 support levels. During the downside, there was a break below a connecting bullish trend line with support at $1,120 on the hourly chart of ETH/USD. It traded as low as $942 recently and it looks set for more declines in the near term.
An initial resistance is around the 23.6% Fib retracement level of the last decline from the $1,150 high to $942 low. However, the most important resistance is around the $1,025 level. The mentioned $1,025 level was a support earlier and it may now act as a resistance. Moreover, the 38.2% Fib retracement level of the last decline from the $1,150 high to $942 low is also around $1,025. Above the $1,025 level, the next hurdle is at $1,046. It is the 50% Fib retracement level of the last decline from the $1,150 high to $942 low.
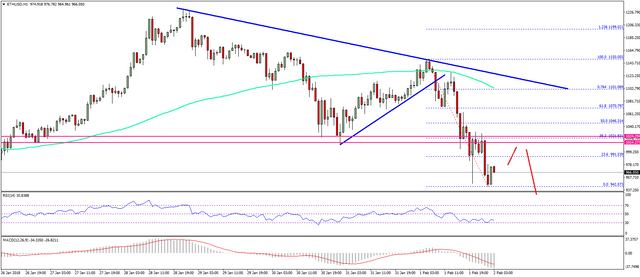
On the downside, the recent low of $942 is a short term support. A break below $942 could ignite further declines toward $900 in the near term.
Hourly MACD – The MACD is gaining momentum in the bearish zone.
Hourly RSI – The RSI is currently around the 35 level and is showing bearish signs.
Major Support Level – $940
Major Resistance Level – $1,025
.jpg)
Key Points
Bitcoin cash price continued to decline and it moved below the $1,200 support against the US Dollar.
There are two bearish trend lines forming with resistance at $1,360 and $1,440 on the hourly chart of BCH/USD (data feed from SimpleFX).
The pair is currently under a lot of pressure and it could even trade toward $1,000 in the near term.
Bitcoin cash price declined heavily by more than $200 against the US Dollar. BCH/USD is now in a bearish zone and is eying further declines.
Bitcoin Cash Price Decline
This week is turning out to be a major declining phase for bitcoin cash price from the $1,450 swing high against the US Dollar. The price extended its decline recently and it even moved below the $1,300 and $1,200 support levels. The current decline is very strong and the price is trading below the $1,180 level. The recent low was $1,159 and it seems like the price may continue to decline in the near term.
On the upside, an initial resistance is around the 23.6% Fib retracement level of the decline from the $1,495 high to $1,159 low. However, the chances are very less that the price may recover above $1,300 in the near term. Further to the upside, there are two bearish trend lines forming with resistance at $1,360 and $1,440 on the hourly chart of BCH/USD. The first trend line is just above the 50% Fib retracement level of the decline from the $1,495 high to $1,159 low.
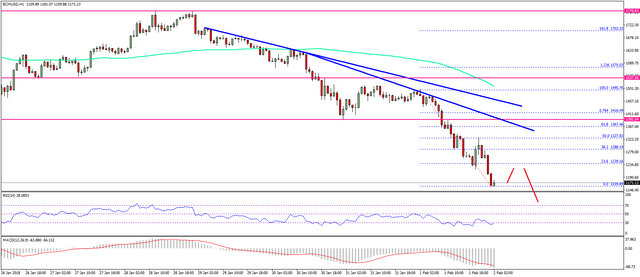
Clearly, there is a lot of pressure on BCH and it could soon break the $1,159 low. The next major support sits around the $1,120 level followed by $1,100.
Looking at the technical indicators:
Hourly MACD – The MACD for BCH/USD placed heavily in the bearish zone.
Hourly RSI (Relative Strength Index) – The RSI for BCH/USD is currently around the oversold levels.
Major Support Level – $1,120
Major Resistance Level – $1,300
Power Up 100% - This option rewards the post in 100% STEEM Power.
Click on the VOTE to get your the reward $

Coins mentioned in post:
Thank you dear @coin.info
Nice to meet you. I first started to get into steemit. I'll follow you. Thank you for a good article.
Thanks dear @durotan, for any question related a blockchain contact to me