[STEEM / BTC: 5-1-18] Is Downtrend in STEEM Just Getting Started?

**Here is the daily chart of today (5-1-18)
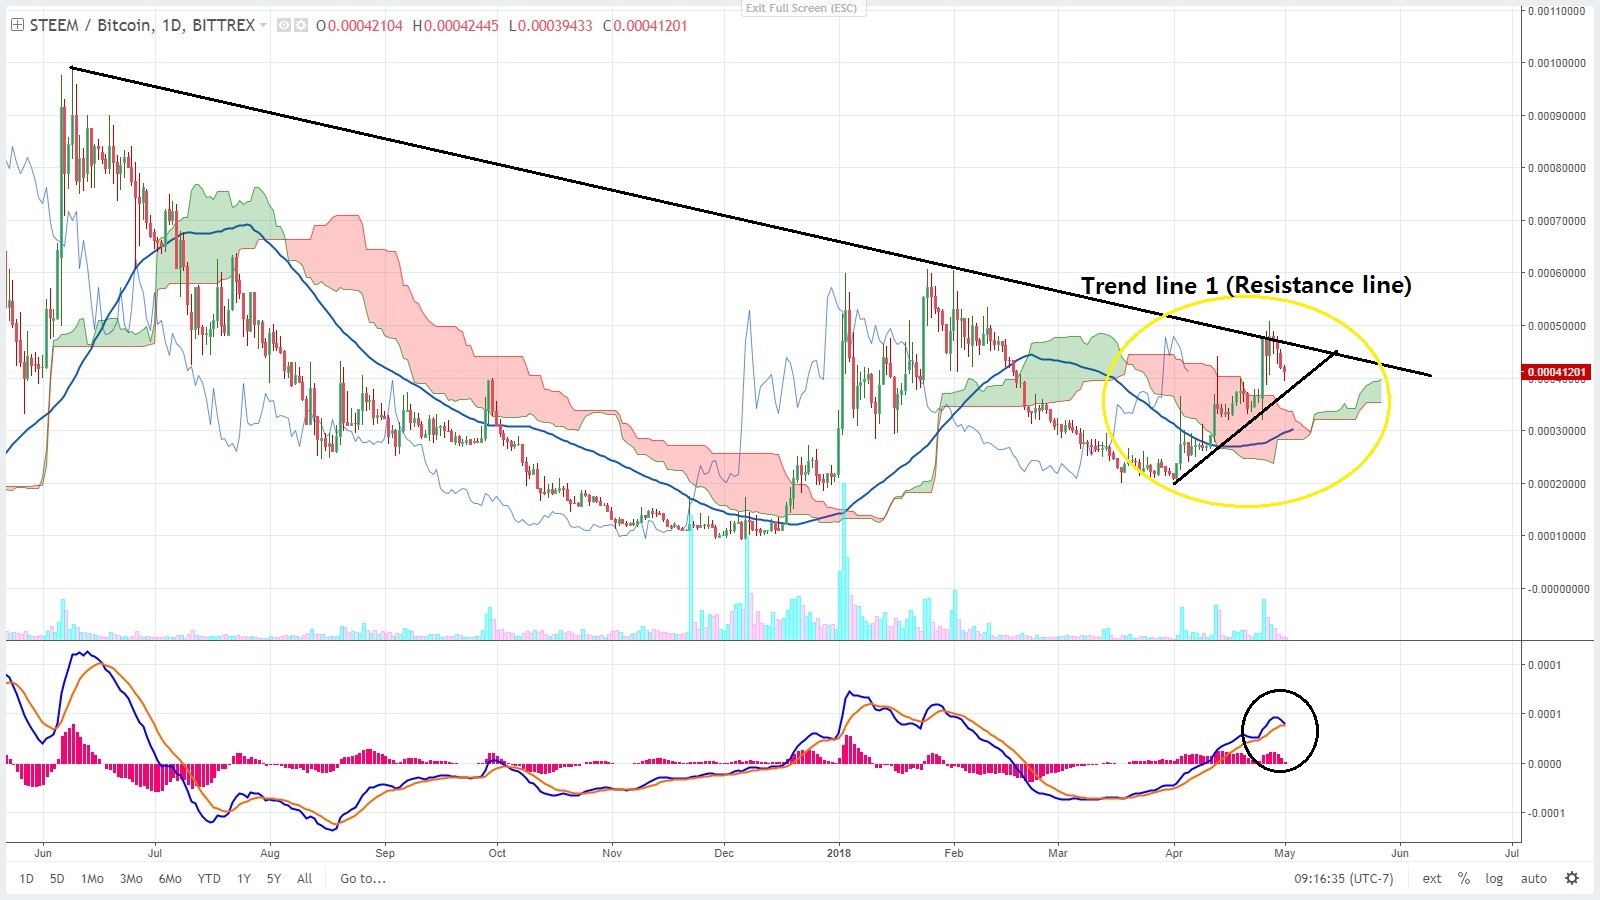
- As you can see, break of the resistance line failed...
- A symmetrical triangle formed.
- MACD is still ok. Hopely it doesn't cross downward..
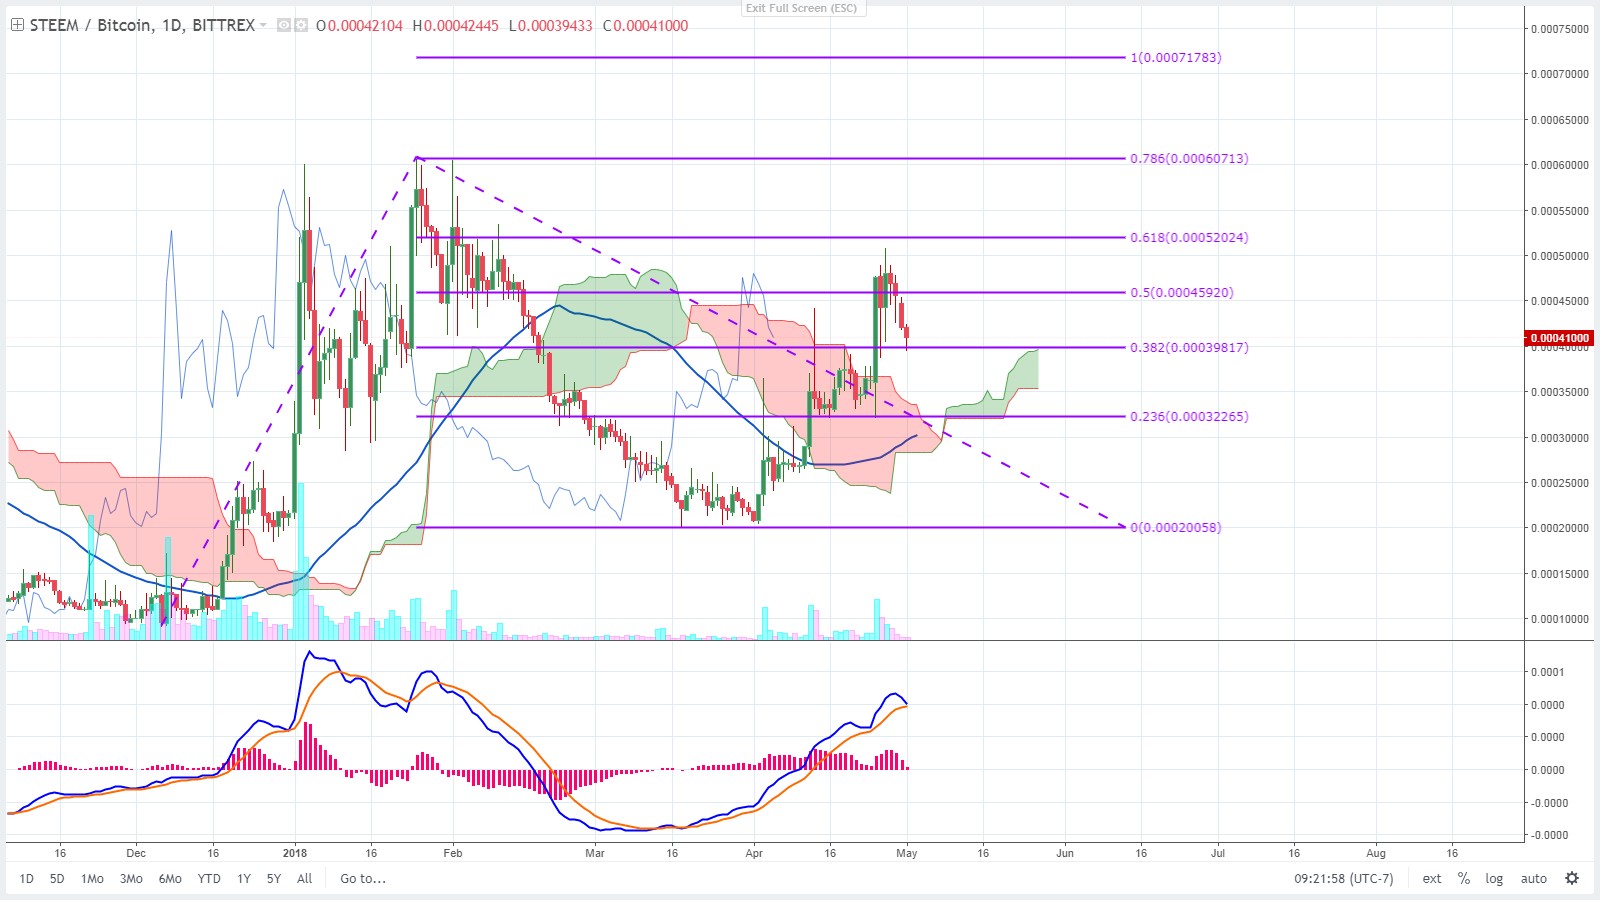
**Here is the another daily chart with the Fibonacci Retracement indicator
- 61.8% retracement & support are @ same spot and
the price bounced from there.- Volume needs to be increased..
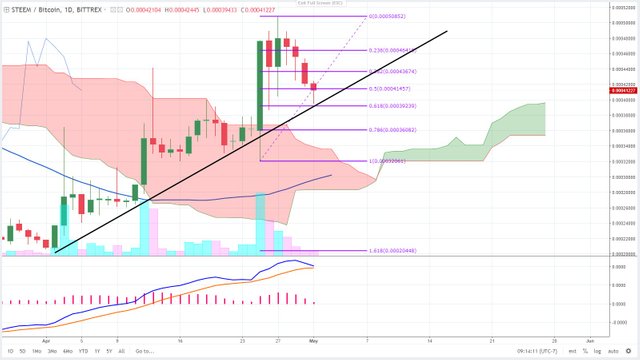
** Another daily chart with the Fibonacci Extension indicator
- The price can be bounced from here and reaches 100% extension which is 0.00071783...hopely.
the support line (0.00039000 area), I believe STEEM can be bounced
from here and takes out the previous high of 0.00060713...
And eventually it might go up to the 100% of Fibonacci Extension.