XRP/USD & XRP/EUR Price Analysis for 04/25/19 Drops Below $0.30
On Apr 3, 2019, Ripple reached a high close to $0.386 and €0.338. A rapid drop followed. Lows close to $0.313 and €0.278 were reached on Apr 15.
Lows below $0.30/€0.27 were reached on Apr 24 and 25. At the time of writing, XRP was still struggling to rise above this level.

XRP/USD & XRP/EUR Prices: Apr 6 – Apr 25 Will the price of Ripple continue to decrease or can we expect a reversal?
Let’s find out:
XRP (XRP): Highlights and Trends For April 25, 2019
- The price of XRP has been on a downtrend since Apr 6.
- It is trading inside a descending wedge.
- Bullish divergence is developing in the RSI.
- Ripple is trending along a long-term support line.
- There is resistance near $0.315 and €0.285.
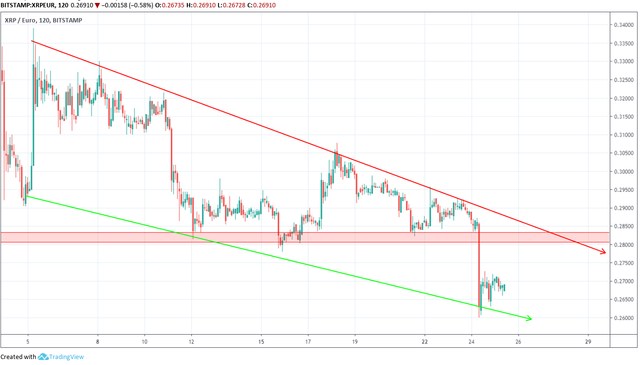
Descending Channel
Tracing these lows gives us a descending support line:

On Apr 5, the price reached a high of $0.386. At the time of writing, several lower highs had been reached.
A descending resistance line is created by tracing these highs.
Taken together, the resistance and support lines combine to create a descending channel:

It is likely that the price will continue trading inside the confines of the channel until a decisive move occurs.
In order to predict the direction of the move, a look at technical indicators is required.
Technical Indicators

However, the divergence is not very significant in value. Therefore, for a more correct prediction, we need to take a look at a longer time-frame.
In the graph below, XRP/USD is analyzed at one-day intervals from December 2018 to April 2019:

The price has been following an ascending support line since Dec 2018.
Based on this indicator and previous price movements, we believe that XRP may make a reversal and move toward the resistance line. Nonetheless, the price may continue dropping after the resistance is reached.
Reversal Areas
We now incorporate resistance areas into our analysis to better determine future price fluctuations.

XRP/USD
XRP/EUR
Currently, the resistance area is within the current trading pattern. An upward movement toward the resistance in the short-term could lead prices to this area.
Summary of Analysis
Based on this analysis, XRP is likely to increase toward the resistance line of the wedge. Prices of over $0.31 and €0.28 may be expected in the near future. After these levels are reached, the price may drop back to current levels or lower.
For price 2019, 2020, and five-year Ripple price predictions click on the green button below:
Posted from Bittabi Bittabi.com : https://bittabi.com/xrp-usd-xrp-eur-price-analysis-for-04-25-19-drops-below-0-30/