$STEEM/BTC Daily Poloniex+Bittrex Technical Analysis Update #30 "Cause the walls start shaking" Aug 29, 2016
Hello Steemers!

Seems like we are entering interesting times ;) Let's see what the charts are trying to whisper..
POLONIEX

4 hour Poloniex chart - Aug 28, 2016
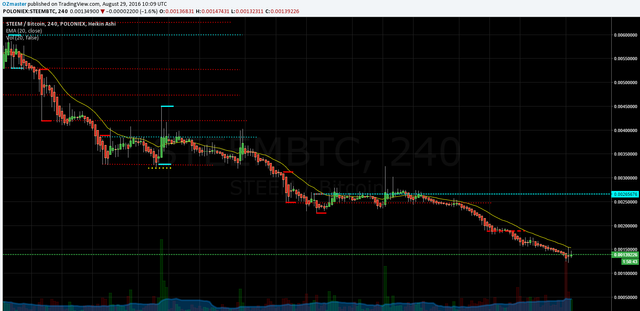
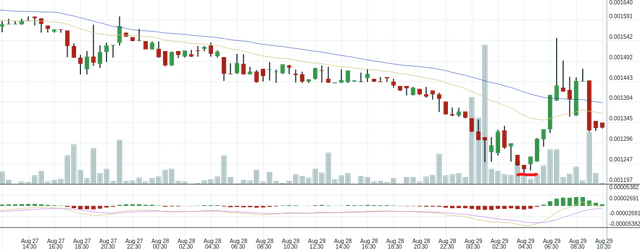
4 hour Poloniex chart - Aug 29, 2016
The Poloniex price once again made a new all time low, this time with allot of volume on the push.
Difference to previous downwards moves is that the volume was really big on this one, in the past we have seen greater volume on the bounces then on the down moves, they were smaller but consistent.
BITTREX

4 hour Bittrex chart - Aug 28, 2016
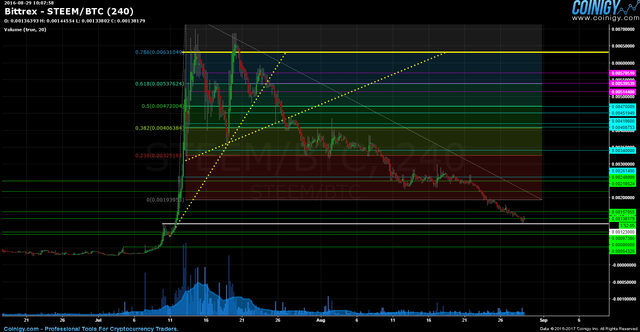
4 hour Bittrex chart - Aug 29, 2016
The Bittrex price made a new local low, hitting a support line (previous high) which i didn't mark before (didn't see, forgot, w.e.) which I now marked with a white line, the price seems to struggle to make a little bounce atm.
VOLUME COMPARISON

STEEM/BTC volume Bittrex Aug 28, 2016
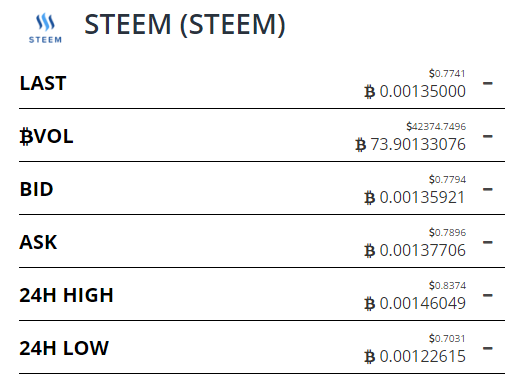
STEEM/BTC volume Bittrex Aug 29, 2016

STEEM/BTC volume Poloniex Aug 28, 2016
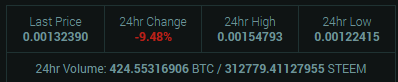
STEEM/BTC volume Poloniex Aug 29, 2016

STEEM indexed global volume Aug 28, 2016
STEEM indexed global volume Aug 29, 2016

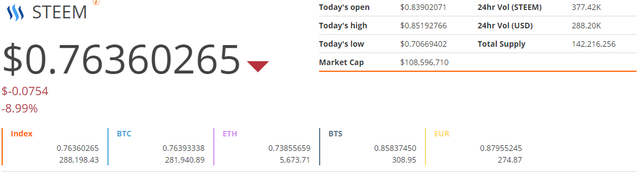
Coinmarketcap top volume cryptos Aug 28, 2016
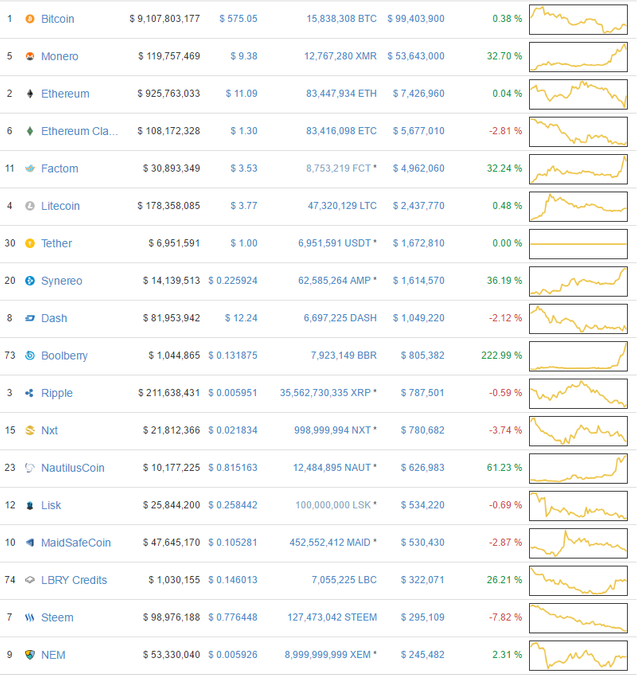
Coinmarketcap top volume cryptos Aug 29, 2016
The volume picked up a little bit on both exchanges, Poloniex still being the leader.
Even thou the volume picked up $STEEM lost a few places in overall volume ranking towards the other cryptos, some coins have gone into pump mode, while steem is still in downtrend, still doing a great job, still at the top of the list!
COMMENT
Once again, I will post the comment by commenting as it involves my personal opinion!
Thank you for understanding!
If anyone has any questions or need's help fell free to ask, I will try to explain as fast and as best as I can.
Critics, comments, reply's, counters, advice's, etc. are always welcome!
Have my charts helped you in any way?Let me know with a comment below :)
Are there more people who are doing TA?
Please post the links to your TA's posts into the comments as well!
DISCLAIMER
I am showing multiple scenarios on the price movement, in the post itself I do not take any stance, either bullish or bearish. I am not responsible for neither you’re winning nor you're losses upon trading! the "comment" section is my personal opinion and does not mean I have to or do hold any positions in the given market.
Kind Regards, OZ :)
COMMENT
If you look at the history the downtrend moves were always mild on volume, and the bounces tended to be the ones with big volume bars, this time it is different.
The fact that we saw quite big volume on this downwards push makes me think that this MIGHT HAVE BEEN the touchdown to the bottom, the volume was big yet the price didn't dive into oblivion.
I think we might see some sideways action, will even be ballsy enough to say that I expect to see the start of the uptrend slowly showing in the course of the next few days.
There is still risk of downward potential but as you can clearly see, it is harder and harder for the bears to push the price down, thus i'd think that the downwards potential is being brought to the bare minimum.
Steem 12-Hour Arithmetic Chart:
If the current horizontal support zone fails (second orange box down), the next support zone (third down, marked with a large black arrow) looks interesting as a potential reversal zone (PRZ) - a spot that might mark a turn into a new bullish uptrend.
Lots of Confluence
If you look at the above chart you'll see an AB=CD harmonic pattern that completes its CD leg just above that horizontal support zone, as well as a bullish bat harmonic pattern that completes its CD leg. Both of these harmonic patterns are counter-trend trading patterns - they are high probability "turning points", or pivot points, in price.
The fact that they both complete within such a narrow price range, added to the fact that the next horizontal price support zone is so close by, makes the case for a lot of demand coming in around that price zone. That could be the spot where a new uptrend starts, or, at the very least, a huge upward correction is Steem's price occurs.
Steem 12-Hour Logarithmic Chart:
Price has put in a pivot low at a confluence support zone, made up of the:
1.) demand line to the price channel (bottom line of the yellow channel)
2.) horizontal price support (second orange box from the top), and
3.) 1.618 fibs extension of the first major reaction to Steem's price high.
Now price is "testing" a resistance zone (highest orange box), if you look left on the chart you'll see that price had previously put in a pivot high at that box. Because supply was there, in a strong way, in the past, there's a good chance that it will be there again. Thus, it's unwise from a technical standpoint to buy before that level is breached.
I drew in what I believe, in my experience, to be the highest probability bullish path scenario - a failure to break the resistance on the first test, followed by a correction to the lower support zone, then a demand surge that finally busts the resistance out of a double bottom pattern. I wouldn't buy until that resistance is taken out, at the very least.
As a trade, stop would go below the lower support (second orange box from the top).
What about the lower low after the big volume in the 30 min chart?
As long as the devs continue selling the @steemit's power down coin, it will probably still be in the down trend.
In this post and especially the comments the situation is explained much better:
https://steemit.com/steemit/@magnebit/steem-price-is-being-pushed-down-by-1-person-speculation-on-why-and-where-it-may-end-up
Good idea would be to monitor the powerdown by @steemit, and as soon as it stops the rally will likely happen. That is my opinion.
well well well looks like you have a nice weekend :)
Nice charts
a chillax weekend :) Thanks allot!
Another way to suspect that this could be the bottom:
The price of steem is now down about 80% from the top, a typical bubble rises explosive and then fall down 70 - 80%. If this is the case, the air is out now and the price can be supported by real fundamentals. Bitcoin was in the same situation and became a very good investment after (and still is). When Steemit is a good platform and more people will use it the price can go up again.
Hi! Hope you don't mind that I've use your yesterday analysis as an example of content on my new http://www.steemsupport.com website. You have great content and it would be great if you would like to contribute in our knowledge base or forum. Maybe with this post! Or with any other analysis! Thank you!
Scary times. These nosediving trends are looking diar. I hope you're right and that things level out... Where's my crystal ball....?
Thank you for detailed information
Nice charts! Thank you for your input as well.
Great post,
This is my analysis:

As predicted last time, Steem / Btc currency pair has reached its low 0.1224.
If you acted as we forecasted the last time, you could earn 30%. Now the situation is following: the lowest volatility was in the previous session, which gives us understanding that the end of the downtrend is near.
That is what we saw today. There was a change in trend and now we are going up. Firstly, we need to test the level 0.0023, which was previously the level of resistance. When we reach this level, you could earn about 46%. A large volume on the last bar tells us that the upward movement will continue.
Aim: 0.0023
Resume: Buy
More crypto-currency in my profile!
And now
It´s like some motorbikes transmission. One speed down and anothers speeds are put up. Now get started a big pump.
Did you steal my icon, you naughty boy?
Nope, my mistake