The state of steemit.com... Google Analytics, visitor distribution and trends.
Some people have been questioning the stats I put up. So here is a more comprehensive set, both from Google Analytics and from Pyramid analytics.
Google analytics only produces visualizations based on generalization in the data set. This prevents a user from hitting their servers too hard by grinding through the entire data-set.
I download the entire data-set, using their API, place it into a SQL Tabular in-memory cube and then am able to visualize the entire data-set with 100% accuracy and no generalizations at will.
Below are some comparative visualizations, distribution and trends.
Here is one I put together 3 months back showing the initial growth of steemit over the first couple of days.
https://steemit.com/steem/@gavvet/my-fellow-steemians-which-one-are-you
Take a look at how we are spreading.
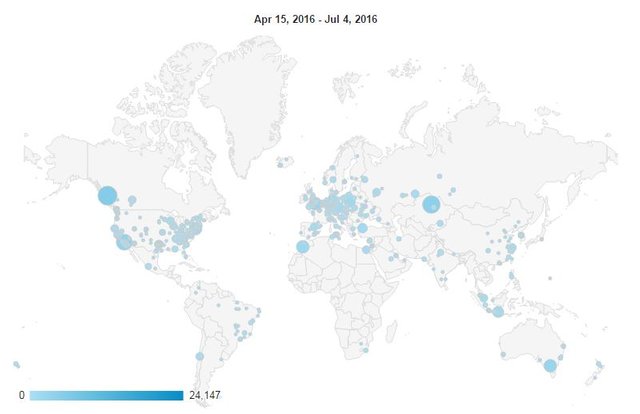
This is pre 4th July distribution and size
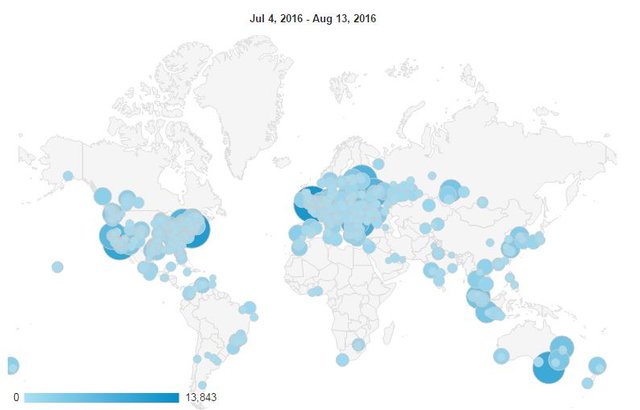
Post 4th July Distribution and size
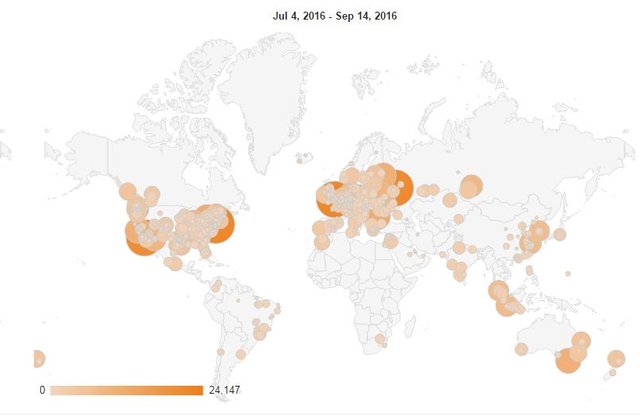
Distribution has shifted a little in the two months and 10 days since the 4th of July
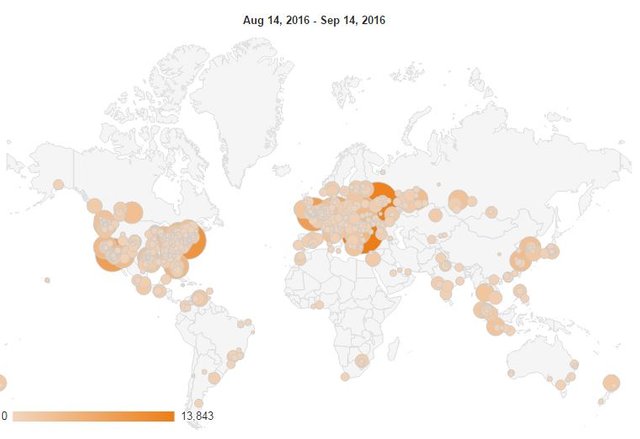
Most notable are the shifts in Australia
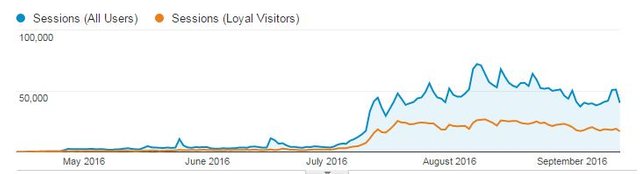
Here are the Google Analytics New Visitor vs Loyal Visitor trend-lines... far flatter due to a greater vertical axis. therefore the peaks and troughs are less pronounced.
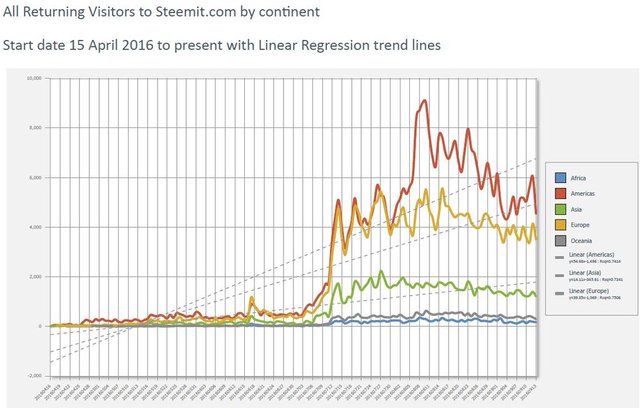
Here are my latest graphs till a couple of hours ago.
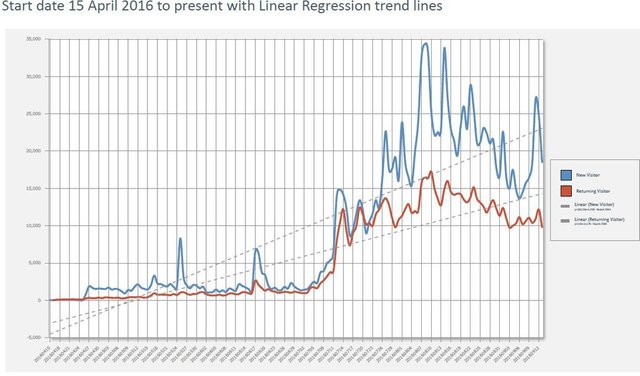
As can be seen the flattening trend is continuing with a slight uptick in the Americas again. There must be some hype again as the New visitors are spiking.
this is my merit
Are you further north than Anchorage Alaska? cause then you are our most northern steemian...
The blimp on the south-west of finland is me and my friends I've gotten into Steemit. :)
Same for most of the blimps in South Africa
Good to see that!
Those delicious bubbles on the map automatically get upvoted...
Thanks @Gavvet nice information!!!! =)
Thanks Gavvet,
i was wondering about this last night,
fi for the best time to post etc.
That is a great comparison and shows that steemit will be huge in the future. The question is now how to make it interesting for vistors to stay and return frequently.
Check out @projectnewbie
Super insightful post as always Gavvet. Love this data.
Will be super interesting to see how all this plays out on a 6-12 month scale.
Fingers crossed it's good.
you can be part of it.
Thanks. Good post.
Awesome info. Do you have numbers for active members in the pacific northwest (Seattle/British Columbia area)?
Have been considering organzing a meetup but not sure how big the population is there (tho it looks promising based on those images).
Thanks and keep up the good work!
which specific cities are you interested in or would make up the feeder area?
seattle, belingham, vancouver (canada) please and thank you!
about 1800 sessions have emanated from those cities in the last week... don't know how many users that would equate to though
Awesome, that seems high enough that it could potentially have a decent turnout.
Thanks so much!
Anytime
Would it be possible to provide statistics for Europe, 10 most active capital cities?