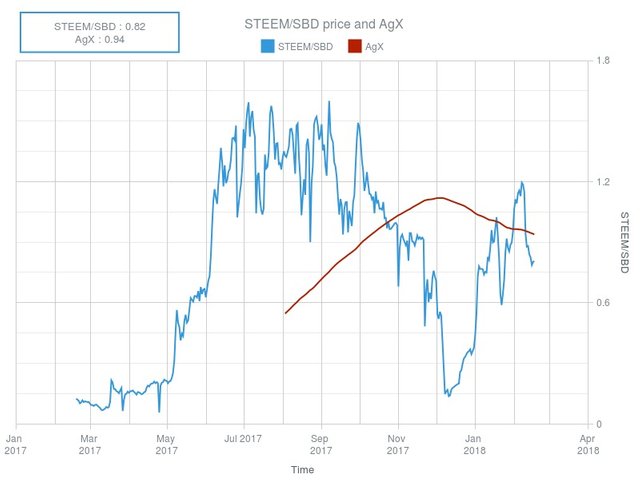
Steem/SBD and AgX evolution - 2018-02-18

This is the daily AgX chart for today 2018-02-18.
Today's 200 day moving average is 0.94 for a STEEM/SBD ratio of 0.82.
What is AgX?
The Mayer's multiple (200 days moving average of the BTC/USD price) is known to be a good indicator of the BTC price evolution.
AgX aims to be a similar indicator regarding the STEEM/SBD ratio, in order for users to find the right moment to exchange their SBD for STEEM at the best possible rate.
When the blue line is at the top 1/3 of the chart it's a historically good time to sell steem for sbd. When it's at the bottom 1/3 of the chart it's a good time to sell sbd for steem. When it's in the middle it's tough to know what's best from a historical standpoint.
Original idea by @aggroed (Vote for witness)
Developed by @stoodkev (Vote for witness)
Thanks for the projection, @aggroed.
Okay, in other words panic sell... :)
Still waiting to cut SBD across! But getting inpatient!
In other words:... Hold...
Wow. I like your post 👍
I like your post Thanks for always letting us into info ✋🏻 @aggroed
I didn't know this explanation of when to exchange SBD/STEEM using the mobile line. Thanks for the explanation colleague @aggroed
thanks @aggroed for this this information now its time to convert SBD to steem.
Momentum indicator?
not much of a change.
i am optimistic that SBD and STEEM are gonna be the next big thing in the crypto space.
Thanks for always letting us into info such as this @aggroed