Crypto Academy / Season 3 / Week 8 - Homework Post for [@asaj]: Crypto Assets and the Random Index (KDJ) by @salma78

Question 1
In your own words define the random index and explain how it is calculated
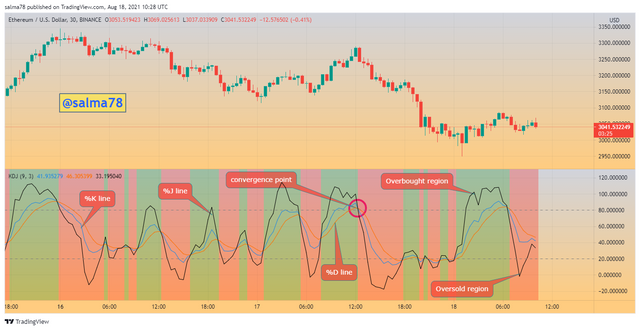
The Random Index (KDJ) is a technical indicator that is commonly used y most traders with the primary aim of making analyses and predicting the future breakout of assets trend price in the market. The KDJ is just similar to the Stochastic Oscillator in that both share some come functionalities. The KDJ is the name of the three lines that it posses that is the %K line, %D line, and %J line. The %K line is the fastest stochastic line which makes it more sensitive to changes in the price of an asset. The %K line response to price change is more than the %D line. When the KDJ indicator is added to a chart, the %K line is usually a blue line, %D being a red line and the %J is a black line by default but these colors can be altered to any preference y the trader.
The KDJ also plays a significant role in scalping trades where it enables traders to scalp profits from the active market. The KDJ should be used wisely or carefully because it can also produce false signals, especially when used in a flat market. As mentioned earlier that the KDJ is similar to the Stochastic Oscillator, the difference is the addition of the %J line included in the KDJ indicator. This %J line functions in signaling divergence of assets between the %K line and the %D line. The KDJ also helps in determining entry points of assets in the market.
In calculating KDJ, the lowest prices, highest prices, and closing prices for specific periods of assets are recommended or required. The KDJ is ranged between 0 - 100 where the 0 mark indicates the lowest price of an asset and the 100 indicates the highest price of an asset recorded. It also helps traders in identifying overbought and oversold through the demarcation of the 80% mark and the 20% mark respectively. Overbought of an asset is determined when the asset's price moves above the 80% level and similarly oversold is determined in a market when the asset's price moves below the 20% level. Let's quickly look at the calculation procedure;
- First of all, the highest, lowest, and closing prices of assets for a specific period are taken and recorded. Let's consider the following as our prices for a day period.
HP = Highest Price of the asset
LP = Lowest Price of the asset
CP = Closing Price of the asset
- Secondly, we identify the relevant day's Reverse value (RSV) of the asset using the formula below;
RSV of the day= (CP - LP)/ (HP - LP) x 100
It should be noted that the RSV Value is always between the ranges 1 to 100.
- After finding the RSV value we then calculate the values of the K and D lines using the formulas below;
K Value of the day= 2/3 x previous day K value + 1/3 x RSV value of the day
D Value of the day= 2/3 x previous day D value + 1/3 x RSV value of the day
- J value = 3 x day K value - 2 x D value.
The KDJ indicator helps in determining the trend price movements of assets in the market. For instance, when the %J line rises above the %D and %K lines then an indication of a bullish trend is signaled. Similarly, a bearish trend is signaled when the %j line moves below the %D line and the %K line. The KDJ indicator also helps traders to identify convergence in the market. Convergence in the market of an asset is determined by the KDJ when the three lines (%K, %D, and %J) are all equal without any above or below each other.
Question 2
Is the Random Index Reliable?
As we all know that there isn't any indicator that we can say it is 100% perfect so the Random Index Indicator (KDJ) is no other but the same. The KDJ indicator does not perfectly produce accurate signals always because it possesses a lagging factor which makes it produce delayed signals resulting in false signals. As stated earlier before that the KDJ indicator is known to produce false signals to traders during flat markets and as such should be avoided use during such periods in the market.
With all its negativity, the KDJ also has some usefulness to traders which tends to aid them to maximize profits in trades. The KDJ indicator enables traders in determining the trend movements of assets. The KDJ indicator when used with other indicators such as the Average Directional Index (ADX), the Average True Range Indicator, etc produces accurate and more true signals than when used alone. With the explanations above, I would say one should not rely solely on the Random Index indicator but should combine other indicators to it for use.
Question 3
How is the random index added to a chart and what are the recommended parameters?
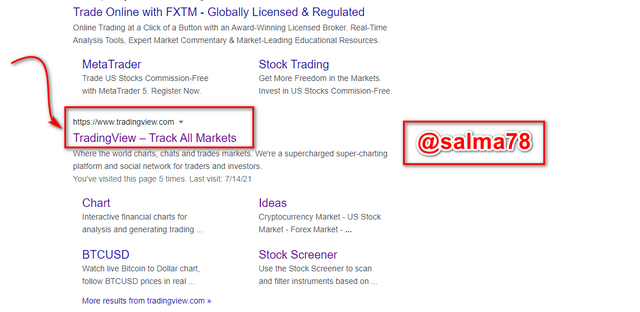
- First of all search and visit the website TradingView.com
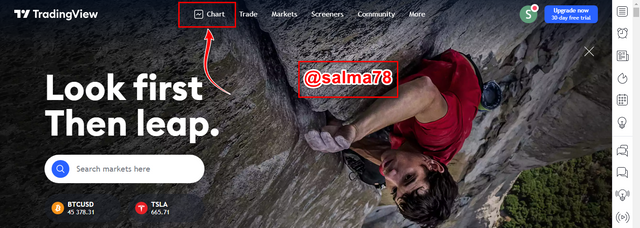
- From the main page click on Chart from the menu tab on the top page.
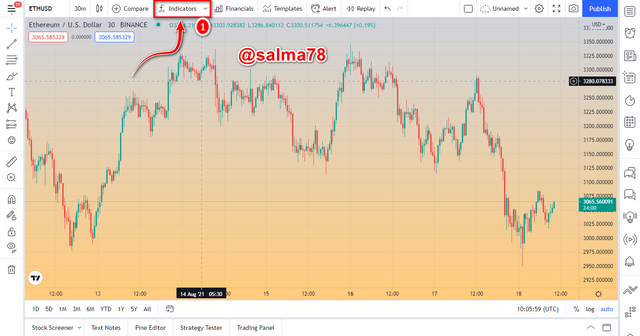
- Now, the Chart is opened as seen above. We then click on the Indicators & Strategies Icon from the toolbar.
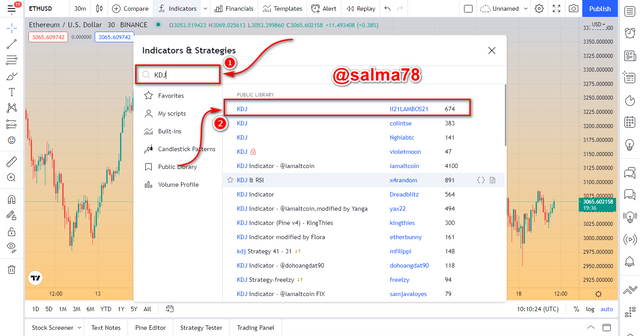
- From the opened menu, search for the KDJ indicator and then click on it to add to the chart.
- Now close the search menu and then verify the addition of the indicator. We can see the indicator added successfully now as shown below.
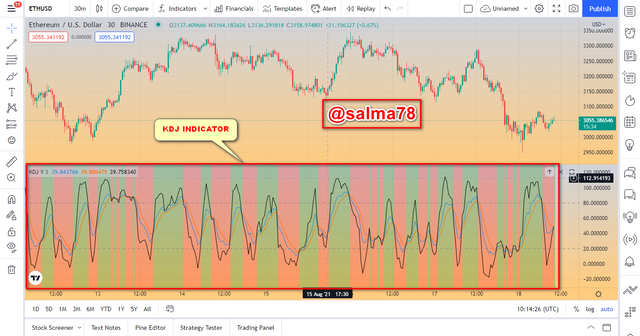
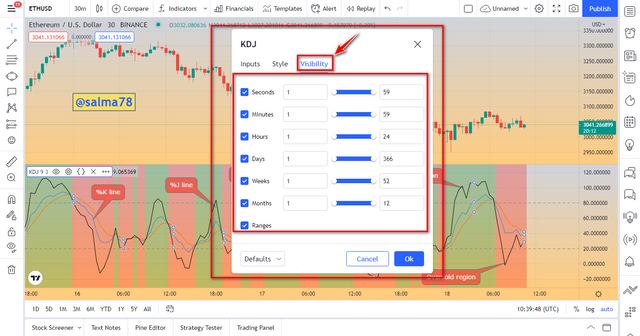
To set parameters, click on Indicator Settings to change any.
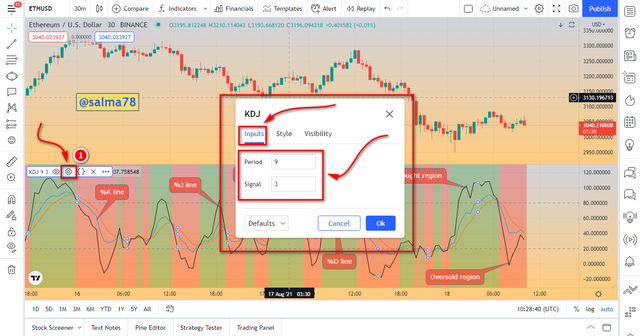
Three different settings tools available, i.e. Style, Inputs, and Visibility.
Inputs Settings:- This setting include the periods and signals which have a default setting of 9 periods and 3 signals just as shown below.
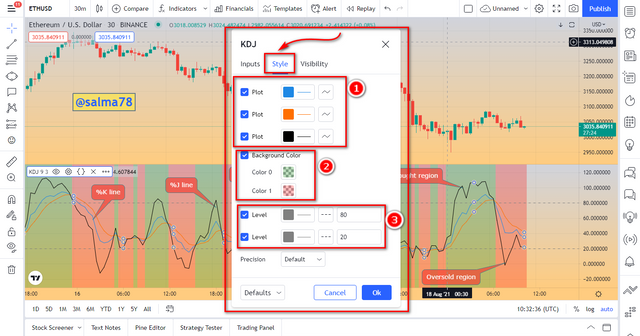
- Style Settings:- This setting includes the color parameters for the three lines of the KDJ indicator (%K, %D, and %J) which has a default color as %K = blue, %D = orange, and % J = orange. This setting also includes the background color parameter which also has a default of light green and light red color. It also displays the overbought and oversold line including the type of line (dotted line) and the color (Ash color).
- Visibility Settings:- The last setting is the visibility settings which includes time frame ranges of seconds, minutes, hours, days, weeks, etc as indicated below. I would leave these parameters at default settings without altering anything here.
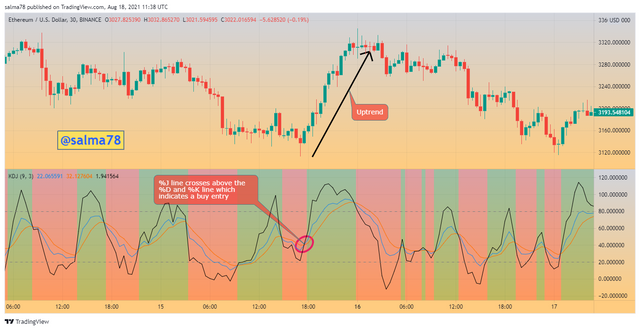
- Uptrend Signal:-
From the chart sown below, we can clearly see that when the %J line crossed above both the %K and %D line a buy signal was initiated which indicates an uptrend in the price of the asset. This bullish trend continued until the %J line crosses below the %D and %K line then a fall in the price of the asset started to occur.
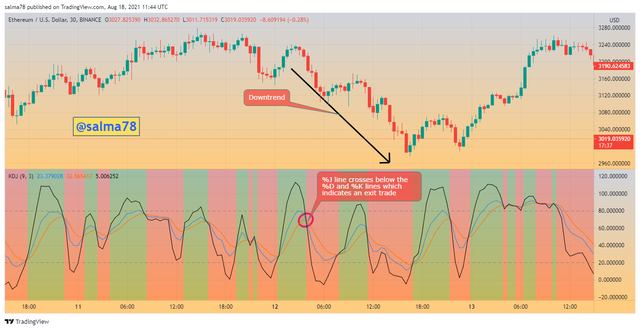
- Downtrend Signal:-
From the chart shown below, when the %J line crossed below both the %D and %K lines, an indication of a downtrend signal started which continued until the %J line crossed over above the two lines where a trend reversal occurred.
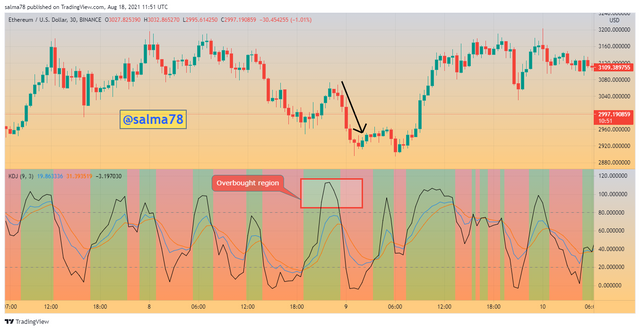
- Overought Signal:-
overbought signals are formed when the %J line crosses above the 80 mark of the KDJ indicator. This where traders/investors start to sell their assets to make profits and avoid losses. When overbought occur, the price of the asset tends to fall because everyone is selling his/her assets. A good example is illustrated below in the ETHUSD Chart.
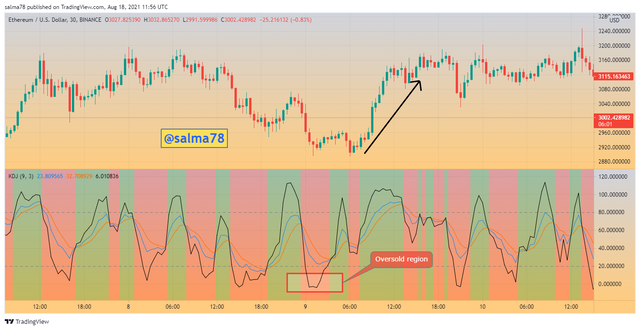
- Oversold Signal:-
Oversold signals are formed when the %J line crosses below the 20 mark of the KDJ indicator. This is where traders/investors start to buy their assets to make profits and avoid losses. When oversold occur, the price of the asset tends to start increasing because everyone is buying the assets. A good example is illustrated below in the ETHUSD Chart.
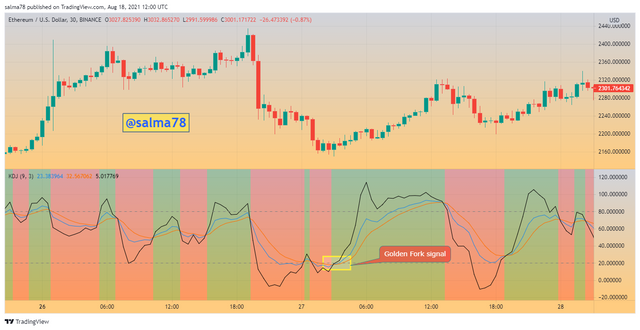
- Golden Fork Signal:-
From the ETHUSD chat shown below, we can clearly see that the %K (blue line) crosses above the % D (orange line) within the oversold region and this indicates a buy signal to traders. Traders/investors take the good opportunities for this signal and exit into a trade.
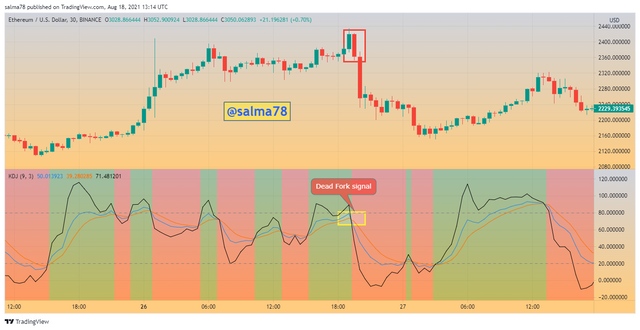
- Dead Fork Signal:-
From the ETHUSD chat shown below, we can clearly see that the %K (blue line) crosses below the % D (orange line) within the overbought region and this indicates a sell signal to traders. Traders/investors take the good opportunities for this signal and enter a trade by selling their assets.
The Average Directional Index (ADX)
The ADX indicator is a type of indicator that is used in determining the strength of a trend of an asset in the market. It ranges between 1 to 100 which is a single line indicator. It has four strength types that it records and I would summarize that in the table below.
| ADX Value | Trend Strength |
|---|---|
| 0 - 25 | No or weak trend |
| 25 - 50 | Strong trend |
| 50 - 75 | Very Strong trend |
| 75 - 100 | Extremely Strong Trend |
This indicates that when the ADX value is below the 25 mark then this is an indication of no or weak trend strength. Also, when the ADX value is between the 25 - 50 mark then it indicates a strong strength. A very strong trend is indicated when the ADX value is between 50 - 75 mark and lastly, an extremely strong trend is indicated when the ADX value is above the 75 mark and this level is very difficult in finding on crypto charts. Without diving into details some of the uses of the ADX indicator, I would like to leave a link here to my last week's homework post on the ADX indicator which was taught by professor @kouba01. ADX Indicator Homework Post
The Average True Range (ATR)
The Average True Range indicator is an indicator that helps traders in determining the movements of assets with respect to the volatility of the assets in the market. Similarly, the ATR is also indicated as a single line but unlike the ADX where it has ranges of values, the ATR records at highs, and lows. This means that when an ATR is high then it indicates a high volatility in the market and when the ATR is low then this also indicates low volatility of the asset in the market. The direction of the asset is not shown by the ATR as in the case of the KDJ indicator. The ATR indicator is mostly used by seasonal traders which aids them on when to enter and exit trades. The ATR values depend on the previous data of the market.
The Random Index Indicator (KDJ)
The Random Index as we have already discussed earlier on has three lines i.e. %J, %K, and %D lines. This differentiates it from the other two indicators where they both have only a single line representing their value. The value of KDJ also ranges from 0-100 where the 80 mark and above is an overbought region while the mark below 20 is the oversold region. The KDJ indicator is used in determining entry and exits points of assets. Although it does not always produce accurate signals as we all know there isn't any indicator that does produce accurate and perfect signals on its own unless used with other indicators.
In summary the table below shows the key differences between the KDJ, ADX, and ATR indicators.
| KDJ | ADX | ATR |
|---|---|---|
| It is a three lines indicator | It is a single line indicator | It is a single line indicator |
| It determines trend by analyzing golden fork signals and dead fork signals | It analyzes trend strength by using the ADX values. | It determines market trends by the highest and lowest price of assets. |
| It indicates when an asset is overbought and oversold | It determines asset's trend strength | It determines the volatility of assets in the market. |
| It should be used together with either an ADX or an ATR indicator to provide accurate results | The ADX should be used together with moving averages indicator to provide accurate signals | The ATR should also be used together with moving averages indicator to provide accurate signals |
| The KDJ indicator is used in determining the price direction of assets | It does not determine price direction | It does not determine price direction. |
Question 4
Use the signals of the random index to buy and sell any two cryptocurrencies. (Screenshot required)
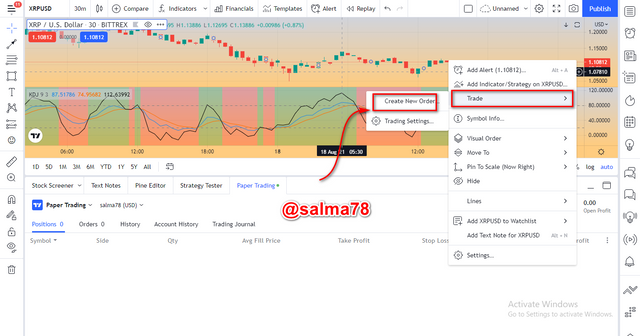
- Sell Order:-
First of all, I select the crypto pair (XRPUSD).
I added a demo account by clicking on Trading panel and then selects a broker (Paper Trading)
The %J line is found to have crossed below the %D and %K lines which indicates a sell signal so I moved further to place my sell order.
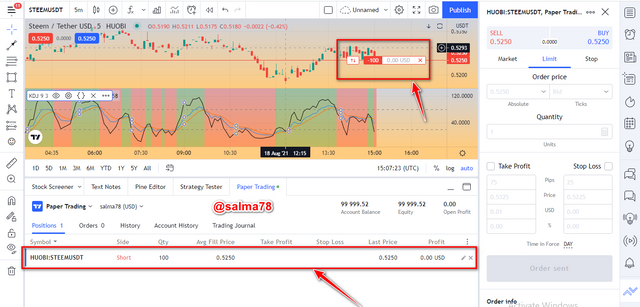
- I then placed a sell order of 100 STEEMUSDT with an entry price of $0.5250
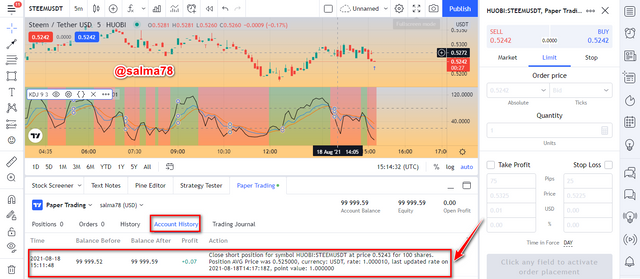
- After waiting for some time I made profits of $0.07USD and then I closed my position. I left the trade with a profit of $0.07USDT This is illustrated from the chart below.
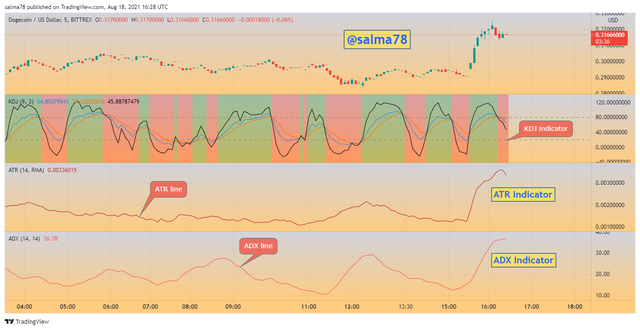
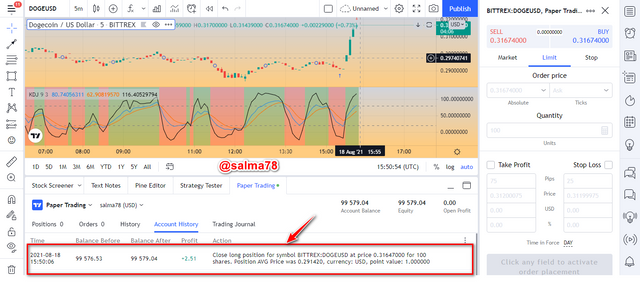
- Buy Order:-
The %J line is found to have crossed above the %D and %K lines which indicates a buy signal so I moved further to place my buy order.
I entered the trade at a price of $0.29142000 and left the trade at a price of $0.31647000
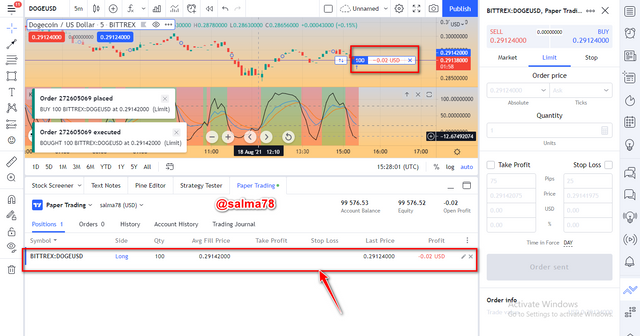
- After waiting for some time I closed my position. I left the trade with a profit of $2.51USD This is illustrated from the chart below.
To conclude, I would like to briefly summarize what we have done in this article so far. First of all, we looked at the concept of the KDJ indicator where we realized that the KDJ indicator is used in analyzing the price trend of crypto assets. We further discussed how to calculate the random index value by looking at all necessary steps and formulas required. We also looked at how the random index is added to a chart using tradingview and the recommended parameters of this indicator.
Moreover, we looked at the differences between the KDJ, ADX, and the ATR indicators including their functions. Finally, We performed two demo trades using the random index signal to buy and sell a crypto asset. The Random Index aids traders in determining the trend of assets but its should not be used lonely rather it should be used with aid of other indicators like ADX.
I would like to say thank you to professor @asaj for such a wonderful lecture taught this week and I look forward to participating in your subsequent homework tasks.
Thank You.