Steem Total Value Powered Up - $34 million - July 16, 2023
This is next in my series of posts reviewing the amount and value of powered up STEEM on the Steem blockchain. For previous posts, see the end of this entry.
Noteworthy in the last week |
|---|
- Week over week, the number of powered up STEEM increased by about 250 thousand SP, or 0.14%.
- Over the course of the week, we saw six daily increases and six new highs in the number of staked STEEM.
- The modeled value of powered-up (staked) STEEM gained ground against all comparison values.
- Changes ranged from 2.13% against SBD to +10% against LTC.
- Compared to the January 1, 2023 baseline, the modeled value has lost ground against BTC, ETH, and TRX. It has gained ground against LTC, SBD, and USD.
- This week's completed powerdowns were reported at 355K, which is a decrease of about 41/2% from last week's 372K.
- We saw 2,721 new accounts created - up from 2,382 last week.
- Net migrations of account classifications showed 3 more orcas, 1 more dolphin, 5 fewer minnows, and 1 more redfish.
- The STEEM token saw an exciting increase on Wednesday (July 12), spiking up to around $0.27, according to CoinGecko, before settling back into the $0.19/$0.20 range during the rest of the week.
- A July 13 judicial ruling came down in favor of XRP in litigation with the SEC. A judge opined that XRP is not a security when programmatically sold on digital asset exchanges, but is a security when sold to institutional investors. It is widely believed that this ruling may have relevance to much or all of the cryptocurrency sector.
- Question for readers: Which graph do you check first when viewing this report?
Here are the numbers as-of a few minutes ago |
|---|
Total value locked in powered-up STEEM (USD): $34,366,854.59
External STEEM market cap (coingecko) $84,582,051.11
Internal STEEM market cap (median_price * current_supply) $85,164,600.00
Locked value in terms of other tokens:
| token | price | locked value equivalent | Jan 1, 2023 | pct of Jan 1 baseline |
|---|---|---|---|---|
| tron | $0.08 | 429,456,845 | 445,758,870 | 96.34% |
| steem-dollars | $2.38 | 14,439,854 | 11,564,498 | 124.86% |
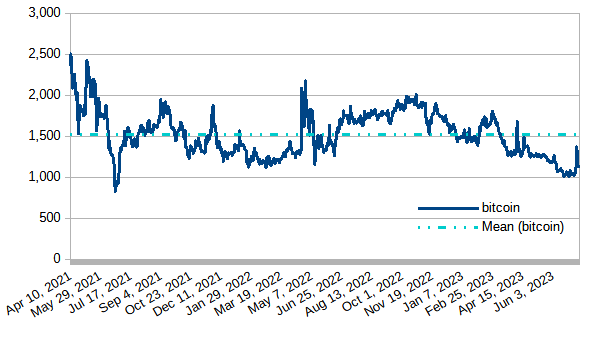
| bitcoin | $30,380.00 | 1,131 | 1,477 | 76.61% |
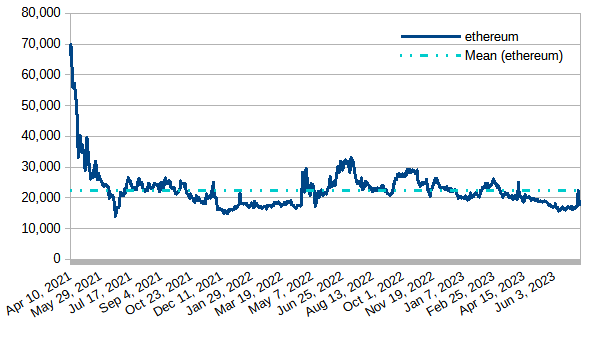
| ethereum | $1,936.94 | 17,742 | 20,406 | 86.95% |
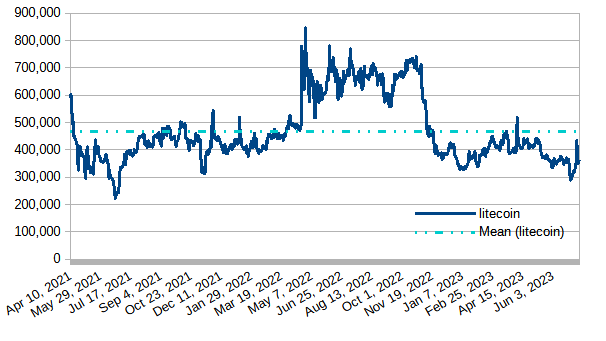
| litecoin | $94.93 | 362,023 | 344,287 | 105.15% |
| steem | $0.19 | 176,779,685 | 166,882,703 | 105.93% |
| USD | $1.00 | 34,366,855 | 24,516,738 | 140.18% |
|
|---|
This slide (new after April 16) takes its data from steemchiller's SDS getVestingStats API call.

Daily Changes
Here is a chart of daily changes in powered-up STEEM from April 11, 2021 to present. The graph also includes a linear trend line and a 28 day moving average. Noteworthy this week, the 28-day moving average continued closing the gap with the zero line.
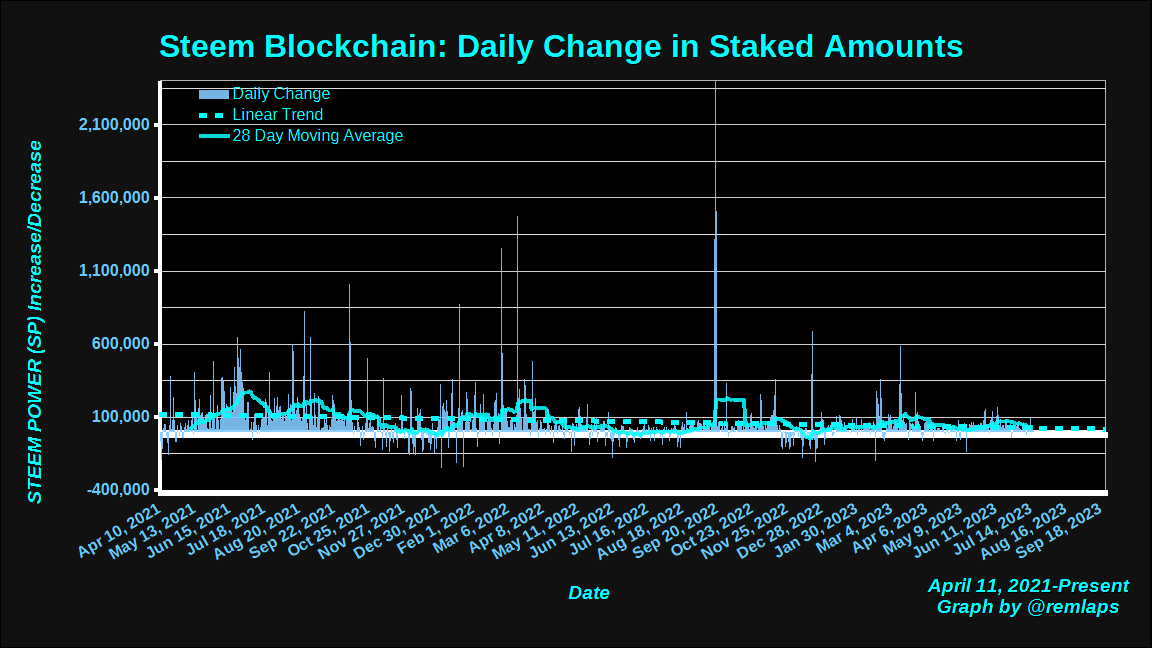
Here are some descriptive statistics, for numbers geeks.

VESTED STEEM
Today's downloaded value was 176,772,688, which is up by about 250K STEEM, or about 1/7% over last week's observed value. The graph continues to show a slight upslope.

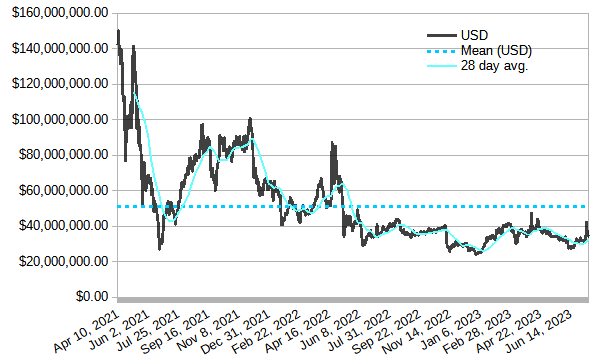
Modeled value of powered-up STEEM in terms of USD
In terms of USD, today's value at download time - about $341/2 million - remains higher than the December 30, 2022 low of $23,718,335.58. It gained about $2 million during the week which represents a gain of about 7%.
Modeled value of powered-up STEEM in terms of Tron (TRX)
Powered-up STEEM reversed course and advanced by about 27 million TRX tokens or a bit over 61/2%. This value is currently about 46 million (~12%) above the June 15 low of 384,259,742.

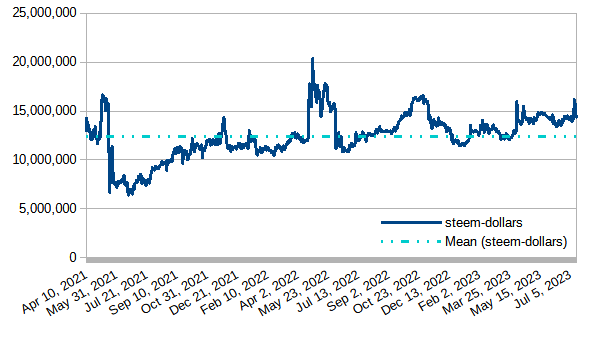
Modeled value of powered-up STEEM in terms of Steem Dollars
Powered-up STEEM advanced by about 304K SBDs, slightly above 21/10%, during the last week.
Modeled value of powered-up STEEM as a percentage of Steem's market cap
With today's observed value of 40.39% the graph swung above the 41% line on Wednesday (July 12) and below the 40% line on Friday (July 14) and back between the two again after that. We have now seen 2 days above 40%; 468 consecutive days above 39%; 532 consecutive days above 37%; 659 consecutive days above 35%; and 722 straight days above 1/3. The graph shows a bit of noise recently, but overall seems basically flat in recent weeks.
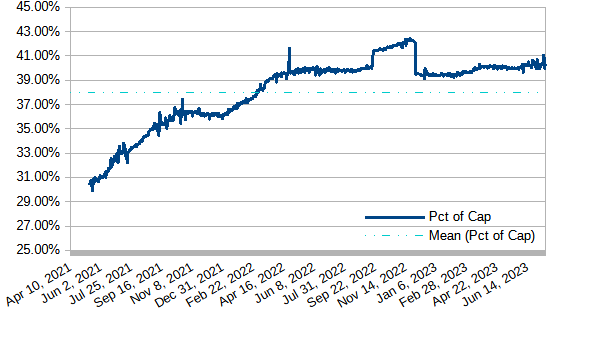
*As previously reported, the big drop on December 4, 2022 was due to a correction in the value that Coingecko is getting for its circulating supply. Numbers before December 4, 2022 were based on an artificially low supply measurement.
Modeled value of powered-up STEEM in terms of bitcoin (BTC)
Powered-up STEEM advanced by about 77 BTC, or 71/4%.
Modeled value of powered-up STEEM in terms of Ethereum
Powered-up STEEM gained again in the last seven days, this week's increase was about 700 ETH, or a bit above 4%.
Modeled value of powered-up STEEM in terms of LTC
LTC kept giving back its gains from two weeks ago. The weekly change for powered-up STEEM against LTC was an increase of about 33K LTC, or 10%. The next anticipated LTC halving is on August 2, so it might be interesting to watch this chart in coming weeks.
Daily Powerdown Activity
Here is graph with data from steemdb.io to show daily completed and pending powerdown activity. The graph shows 355K in completed powerdowns last week and 537K pending (both measured from Sunday through Saturday[GMT time zone]). This represents a potential increase in powerdowns by about 51% or less.

The horizontal lines are the average values for completed (blue) and pending (cyan) powerdowns, and the yellow line is a 28 day moving average of completed powerdowns. "Pending" numbers now come from the Steemit API, not from steemdb.io.
Here are some descriptive statistics for the numbers geeks

| And with a total of 1,138 pending power downs (down from 1,203 last week), here are the times, dates, and amounts of the top-10 |
|---|
1 2023-07-16T22:40:24 - 139,756,255 VESTS, 79,515 STEEM
2 2023-07-21T21:29:09 - 57,260,474 VESTS, 32,579 STEEM
3 2023-07-17T02:37:39 - 52,854,638 VESTS, 30,072 STEEM
4 2023-07-21T21:28:18 - 50,833,447 VESTS, 28,922 STEEM
5 2023-07-22T10:15:18 - 50,306,881 VESTS, 28,622 STEEM
6 2023-07-18T14:42:12 - 44,967,992 VESTS, 25,585 STEEM
7 2023-07-18T18:19:21 - 43,956,579 VESTS, 25,009 STEEM
8 2023-07-16T22:01:24 - 35,170,189 VESTS, 20,010 STEEM
9 2023-07-21T16:32:42 - 22,008,463 VESTS, 12,522 STEEM
10 2023-07-20T01:53:48 - 21,962,913 VESTS, 12,496 STEEM
Notes
- Reference prices for STEEM and other tokens are downloaded from coingecko.com
Previous posts
- Steem Total Value Powered Up - $34 million - July 16, 2023
- Steem Total Value Powered Up - $32 million - July 9, 2023
- Steem Total Value Powered Up - $32 million - July 2, 2023
For links from 2021, 2022 and the first half of 2023, see these posts:
- Steem Total Value Powered Up - $32 million - June 25, 2023
- Steem Total Value Powered Up - $67 million - January 2,
20212022 - Steem Total Value Powered Up - $36 million - June 26, 2022
- Steem Total Value Powered Up - $26 million - December 18, 2022

Pixabay license, source
Reminder
Visit the /promoted page and #burnsteem25 to support the inflation-fighters who are helping to enable decentralized regulation of Steem token supply growth.
It could be interesting to have some data about the delegation like the % of locked SP that are delegated and maybe which account have the most incoming SP
I agree that this would be interesting information, but collecting it would be a bit more complicated than what I'm showing here. I am not really aware of a good way to collect and save the additional data I would need over the course of time.
I do the POWER UP on a weekly basis, the advantages of doing it are many, so I will continue doing it, it is quite beneficial
250 thousand SP increasing sounds really good and I wish the rate may increase more in upcoming days. Thanks sir for sharing the details with lots of data and analysis in this post. Wish to see steem to the moon.
Thanks for the great report. And I'm wondering how many coins users have on accounts that they don't use. So to speak, they lie on cold wallets only under the percentage of the system itself in the power of the voice.
I've been wondering about this, too. I have thought about doing a report with the number of active accounts per day/week/month, but this is another report that would require some effort to put together. I'm not sure if/when I'll have time to do it.
thanks for the analysis.. something interesting happened this week on Steem price. first a great increase was achieved, then it was back to its old price. It was something like a shakedown. There is not much increase in the amount of steem power. close to previous amounts.
Yep. Over the course of years, I have come to expect that any time I see a sharp and sudden rise like that, it's going to settle back down to the original level in the following few days.