On-chain Metrics(Part-3)- Steemit Crypto Academy- S4W5- Homework Post for @sapwood

Hello my good friends, hope you are all doing well. It is great to participate in season 4 week 4 of steemit crypto academy. I will be doing the home work task of @sapwood as he lectures us on **On-Chain Metrics(Part 3).

(1) How to calculate Relative Unrealized Profit/Loss & SOPR? Examples? How they are different from MVRV Ratio(For MVRV, please refer to this POST)?
How to calculate Relative Unrealized Profir/Loss
To calculate Relative Unrealized Profit/loss, there are other onchain metrics that will be calculated first, which will now be used in calculating the Relative Unrealized profit/loss.
First, we have to calculate the Unrealized Profit/Loss.
So what is the Unrealized Profit/loss?
Unrealized gain/loss is a theoretical profit and loss. We may also define it as a potential profit or loss from our assets or investment.
For example, if we have a crypto asset we are holding, assuming we bought at $2 and the current price in the market is $5, our unrealized profit will then be $5-$2, which will be equal to $3.
It is unrealized because we have not sold off the asset yet. It can only be realized when the said asset have been sold for cash and we are not hodl it anymore.
This is applicable to unrealized loss. Assuming the same asset above have a current market price of $0.5, the unrealized loss will be $0.5-$2, which will be $ -1.5. This means that the asset have an unrealized loss of $-1.5. It will be an actual or realized loss when we sell off the asset at that current market price for cash.
Thus unrealized profit/loss is referred to as floating profit/loss, since it has not been realized, it is still on paper.
This takes us back to the last lecture from @sapwood concerning market cap and realized cap.
The market cap was defined as the the total circulating supply of a coin multiplied by the current market price. This gives us the market value or cap
The realized cap was defined as the summation of all the multiplied UTXOs with the prices as at the time it was last moved or transferred. In this case, the various UTXOs are multiplied at the different price at which they were moved, then their values are all summed up, to give the realized cap.
To calculate the Unrealized profit/Loss, we will use the formular
Unrealized profit/loss = market cap(current value) - realized cap(realized value)
If the answer is positive, it becomes an unrealized profit.
If it is negative, it becomes an unrealized loss.
Having come to this point, let us now show how we calculate Relative Unrealized Profit/Loss.
Relative Unrealized profit/loss help us to identify how unrealized profit/loss changes over time. It helps to determine what stage of the market we are. This is very advantageous for long term investors.
The formular for calculating the Relative U realized profit/loss is
Relative Unrealized Profit/Loss = (Market cap - Realized cap)/Market Cap
Let us now illustrate this, from my last assignment on onchain metrics -part 2,
My Market Cap was $210,000
Realized cap was $162,000
then the unrealized profit/loss = MC-RC = $210,000 - $162,000 = $48000
Therefore
**RUPL = $48000/$210000 =0.23.
This shows that the market is in a period of fear and hope.
How to calculate SOPR(Spent Output Price Ratio)
SOPR is a metric that shows the extent of profit or loss for any coin that was moved on-chain. It gives an investor insight on the overall market sentiment, the profits and losses over a period of time. It takes into consideration the value of the cash as at when the UTXO was created and the cash value as at when it was spent.
With the SOPR, we can identify the local tops in a bullish market and the local bottoms of å bearish market within a specific period of time.
So SOPR is the ratio of price sold to the price paid for any given asset.
A rise in SOPR > 1, signifies that investors are selling their coins off at a profit, and if it continues moving higher, it is indicating an imminent correction in the market.
A drop of SOPR < 1, implies that the investors will be selling at loss. They would prefer to Hodl, drying up the supply in sell section, thus enabling a bullish reversal.
When SOPR is equal to 1, it show that the investor is in an equilibrium, no profit, no loss.
From the explanation given above, we can deduce the formula to be
SOPR = Realized value of spent UTXOs/purchase value of spent UTXOs.
Let us now illustrate this.
Y coin have a total supply of 20 coins and 20 UTXOs in total, the value during creation or purchase was$2800 onJune 2020. 7 UTXO was last transferred to another wallet when the price was $3000 on August 2020. 8 UTXO was last moved to another wallet September 2020 when the price was $7000 and 5 UTXO was last moved or transferred to another wallet on December 2020 at the price of $8000.
The realized value of spent UTXOs = (73000) + (87000) + (5*8000)
= 21000+56000+40000
Realized value of spent UTXOs = $117,000
The purchase value of the UTXOs will be = 20*2800 = $56,000
Therefore, the SOPR = 117,000/56000 = 2.01.
Please note, that in the example above, the UTXOs were bought at the same time, it can be applied for the same coin bought at different prices within the same period of time.
So when the SOPR is greater than one, implies that the hodl realized profits, but when it is less than one, it means he sustained losses.
Difference Between SOPR and MVRV
| Sn | SOPR | MVRV |
|---|---|---|
| 1 | highlights the profitability or loss of a coin that is moved (spent UTXOs) at a particular period of time | while MVRV considers the average profitablity or loss by using the market cap and the realized cap of the entire circulating supply of the coin. |
| 2 | It is the ratio of the cash value of spent(UTXOS)coins to the cash purchase values of the same(UTXOs) | It is the ratio of the market cap to realized cap. |
| 3 | It show the realized profit/loss for the transactions done for that period of time | It shows increase or decrease in unrealized profits. |
| 4 | it only considers coin on which transactions where carried out | All the circulating number of coin whether active or dormant are involved in its calculations. |
**Difference between RUPL(Relative Unrealized Profit/Loss)
| Sn | RUPL | MVRV |
|---|---|---|
| 1 | This is the difference Market cap and Realized cap divided by the Market Cap | this is the ratio of Market cap to Realized cap |
| 2 | This is used to determine the stage of market cycle we are | This is basically used to determine the profitability of the market. |
| 3 | it assists to identify historic tops or bottoms | while this is all about determining the trends in the market. |
Consider the on-chain metrics-- Relative Unrealized Profit/Loss & SOPR, from any reliable source(Santiment, Glassnode, LookintoBitcoin, Coinmetrics, etc), and create a fundamental analysis model for any UTXO based crypto, e.g. BTC, LTC [design a model to identify the cycle top & bottom and/or local top & bottom] and determine the price trend/predict the market (or correlate the data with the price trend)w.r.t. the on-chain metrics? Examples/Analysis/Screenshot?
Relative Unrealized Profit/Loss
We have earlier mentioned that RUPL is a ratio of unrealized profit to Market cap.
When we are using this metric, if the reading is above 0.75(75%), this means that it is about time for profit taking soonest.
When the RUPL goes below 0.00(0%) it implies a accumulation zone or historic bottom. We can also interpret in this way, if the readings are between 25% and 75%, we may be either in a bullish market or bearish market.
Additionally, RUPL can also help investors to identify the different market cycles and tell them which stage they are in
Let us now match the RUPL readings to the market cycle.
| RUPL reading | Market cycle stage |
|---|---|
| 75%(0.75)and above | Euphoria |
| 50%(0.5) to 75%(0.75) | Greed |
| 25%(0.25) to 50%(0.5) | Optimism- Denial |
| 0%(0.0) to 25%0.25) | Hope-fear |
| 0%(0.0)and below it | capitulation and accumulation |
Let us now use a chart to illustrate that
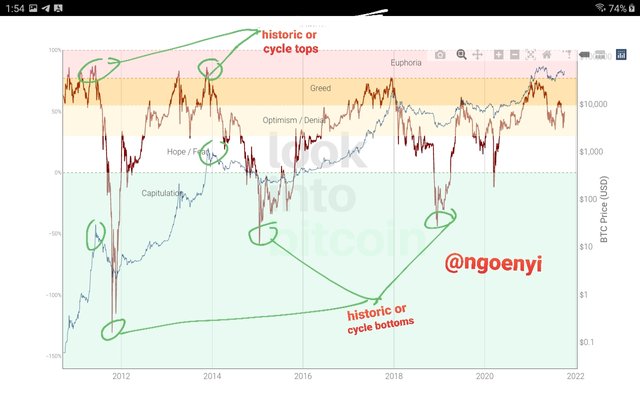
From the chart above, we can see that the last time the BTC market entered a negative RUPL was on March 2020, when it had about -0.11 RUPL value and the price was between $5000 and $6000. Since then, its value have been on the rise. As at 21st September 2021, the RUPL was 41%(0.41) at a BTC price of $41,656 as at October 4, 2021, it also rose to 49%(0.49) with a price of $49,290.
Being at this point, the indicator is showing a bullish momentum, and we expect it to continue its rise up to the 75% RUPL value.
We also observed that at any point a historic top is formed, we will see that it is the point of the highest price for that period. The historic bottoms also follows the least drop in price.
So from the above analysis, it is obvious that the Relative Unrealized Profit/Loss have a direct correlation with price. I said this because, as the price increases, the RUPL value also increase and vice versa.

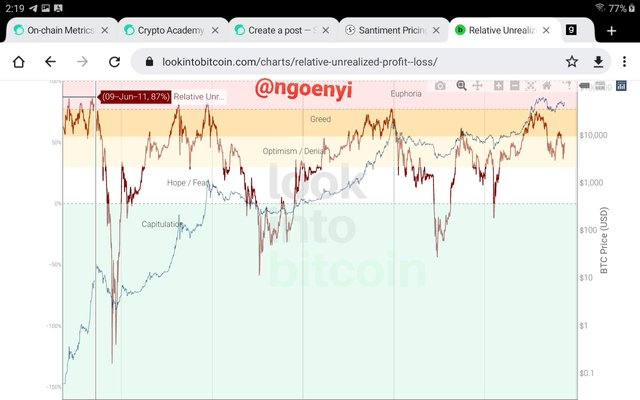
The chart also helped us to know the phase we find ourselves presently in the market cycle. Before now, on 9th June 2011, the market was at its euphoria stage, at 87% RUPL, that was followed by a massive selloff, which led to the creation of a historic bottom that same year, thus forming a strong support.
The market went up again, on November 22, 2013, the RUPL increased to 84% again, you can also notice that it was at the euphoria stage again in the chart.
Remember, that we said that once we are in that stage, hodlers will sell off their asset to take profit, causing a reversal in the market. It repeated itself once more.
Currently we are in the Optimism phase, trying to enter the greed phase. If BTC should continue in its upward momentum, then we might retest the greed phase and finally enter euphoria stage once more.
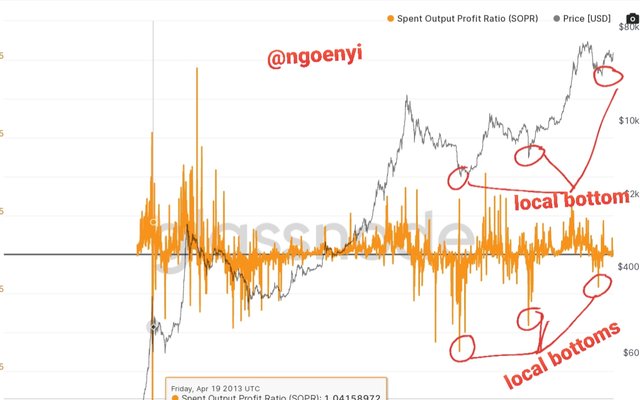
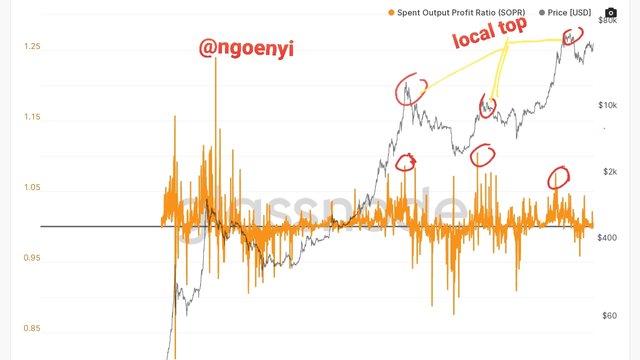
Spent Output Price Ratio(SOPR)
SOPR is another on-chain metric that is used to identify local bottoms and tops of a bullish or bearish cycle. To understand its reading,
● when the SOPR is greater than 1, it form a local top
● when it is less 1, it creates a local bottom.
● when it is leaving the bottom and is around 1, it signifies a buy signal
● when it is leaving the top and is moving down around 1, it is a sell signal.
The higher the SOPR value, the higher the price, increased profit for investors, increased distribution and increased supply liquidity.
We can use the charts below to explain more
source
Local bottoms
source
Local tops
SOPR is a ratio of price sold to price paid for all transactions conducted within a given time. Thus it shows the profit that was realized at a given period. When we have successive peaks of SOPR, it indicates an uptrend. This implies a continous distribution of the coin. However, as the coin is spent or sold, it increases liquidity in to the market thereby causing the local top to increase.
From the chart above we also noticed that the last time we also had a major local bottom of the bullish rally of BTC was on March 2020, there after a macro top was formed on April 2021.
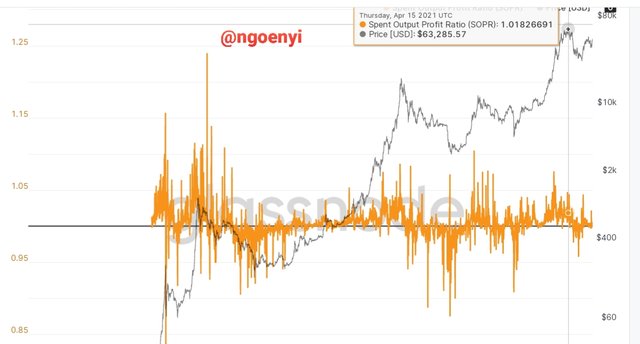
source
Macro top formed at $63k with a SOPR value of 1.02
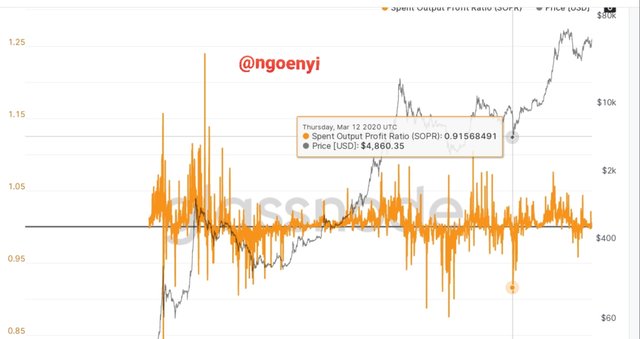
Local bottom formed at $4k with an SOPR value of 0.92.
From the major local bottom formed when the SOPR was 0.9, the SOPR value have been hovering around 0.9 to 1.02 value.
In conclusion, we can deduce from the above explanations, that SOPR is directly correlated to price. The higher the price of the coins the higher the SOPR value and the lower the price, the lower the SOPR value as well.
Write down the specific use of Relative Unrealized Profit/Loss(RUPL), SOPR, and MVRV in the context of identifying top & bottom?
Uses of SOPR
A person can determine from the SOPR value whether investors made profit on a particular asset or not.
Knowing the value range of the SOPR will assist an investor to recognize a local top, with the knowledge that a correction in price comes after the top is formed. If we look at the SOPR charts above, we will observe that each top formed is followed by a correction in price. Thus the trader or investor can decide to follow the price down and make some profit before the correction is over.
On the other hand, the investor can also sell off his overvalued asset at the local top, then wait and invest once the price hit the support or local bottom at an lesser price.
Additionally, an investor can use the SOPR range to know that investors in a coin, like bitcoin, are no more selling because of the conviction they have that the price will move up further than where it is. This will also lead to drop in SOPR value.
So this on-chain metric can be used in various ways to identify the tops and bottoms.
USES OF RUPL
The tops of RUPL indicates to the investor that it is time to take profit for their assets, while the historic bottoms acts as a support point for the assets. From the charts above, we noticed that historic bottoms have not been broken at any time, thus a serious indication of accumulation zone. So it is time to buy.
From the RUPL chart above , we can confirm that the tops and bottoms have proven to be reliable for long term investors.
USES OF MVRV
The MVRV is the ratio of Market cap(value) to the Realized cap(value). This on-chain metric provides upper thresholds which can be referred to as the tops while the lower thresholds can be referred to as the bottoms. The tops of a MVRV signifies a potential sell off even though such may not be guaranteed. However, the bottoms which signifies accumulation or capitulation can be relied upon as a buy signal.
Additionally using the tops and bottoms of a MVRV, one can identify the trend in the market using the formation of HH and HL for a bullish trend or LH and LL for bearish trend.
Conclusion
This lecture have proven to be very useful to me. I have added another set of on-chain metrics indicators to my wealth of knowledge. I have also realized which particular metrics can be used to determine the profitability of the market each day considering only the transactions that was carried out and their purchase price.
This lecture have also taught me which indicator is to applied for a specific result. However, to get the best result out of them all, it is advised to use them along with other indicators.
Thank you @sapwood for this wonderful lecture.
Respected Mam, please verify my achievement task 2 post
https://steemit.com/hive-172186/@zohaibb/achievement-2-basic-security-of-steemit-zohaibb
https://steemit.com/hive-172186/@shahzadrajpoot8/achievement-3-or-or-etiquette-content-by-shahzadrajpoot8