Simple Introduction to Bullish Divergences in Crypto Currency Market

Background Image Source- Canva.com/Location

Assalam-o-Alaikum Steemians !
I'm @moneyster, a professional level Cryptocurrency investor and an analyzer. As usual, today I thought to share another Crypto-related experience with you. I hope this article will be considerably beneficial for all the Steemians in this community
.gif)
 |
|---|
Basically, Bullish Divergences are some good Trading Opportunities that can be used to Buy cryptocurrencies during a considerable bearish market. In this case, we all know that when the Market drops rapidly, we should focus on the oscillator indication as a comparison to the market price.
Here we can use a lot of indicators to find these Divergences. As an example, RSI (Relative Strength Indicator) can be defined as a good indicator for finding Bullish Divergences in a chart.
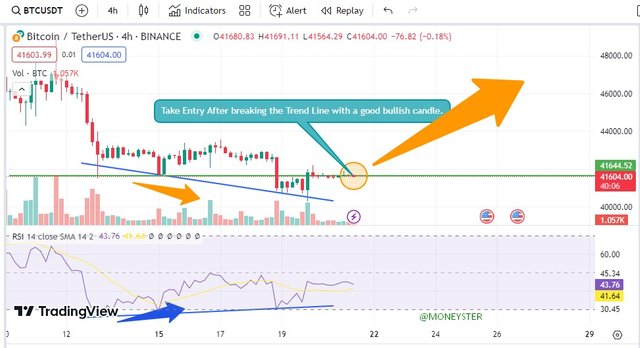
When the Market price goes to the downside but the RSI (Relative Strength Indicator) goes to the Upside of the range, it can be defined as a Bullish Divergence. At the same time, we can call it as Hidden Divergences.
.gif)
As I said above, Bullish Divergences are valuable Trading opportunities for us to buy Crypto assets or take an entry for a long Trade. When we compare these Bullish Divergences with some other Trading indications, the accuracy of these Bullish Divergences is quite high. We can also follow these Bullish Divergences to study the current Market behavior and keep hope of a near Market change. It means that when we see some Bullish Divergences in the Crypto Market, it also means that a huge price change can occur soon.
.gif)
First of all, I would like to add an indicator to the price chart. So here I will add RSI indicator to my Crypto Chart using the TradingView platform. Then we can go to "Indicators" from the tool panels and search " RSI" in the giver search bar. Below I have included a screenshot to demonstrate adding the RSI Indicator to our chart.
 |
|---|
Below I have demonstrated some good zones provided by this RSI Indicator according to my analysis. Here we can see good zones to buy our assets or take a long entry when the RSI Indicator shows its direction to Upward and the price chart shows downward. If the signal is strong, we will be able to see a good bullish movement after a certain time. However, here we have to follow at least a 4H time frame to get an accurate signal.
 |
|---|
In this way, we can easily use this RSI Indicator in the chart and take more accessible trading opportunities. However, we can try to combine this strategy with some other indicators to increase the winning percentage at all.
At the same time, as I said in my previous article, we should remember that all the indicators and strategies are not efficient completely as nothing we can find 100% efficient in the world. So, we should depend only on these strategies and indicators to confirm our trading opportunities.
.gif)
I have studied the below-sourced articles to study these topics further, and I have explained all the above facts in my own words and experience.
10% benificiary set for @tron-fan-club

Twitter Shared
https://x.com/moneyster12/status/1748972259786514798?s=20
I agree that technical assessment is very important and can help us figure out the next expected market move however not everyone is familiar with this. I also believe that fundamentals are equally important for any project and I like the way you have explained about the bullies divergences in the crypto market.
Thank you for your valuable comment.
Thank you, friend!


I'm @steem.history, who is steem witness.
Thank you for witnessvoting for me.
please click it!
(Go to https://steemit.com/~witnesses and type fbslo at the bottom of the page)
The weight is reduced because of the lack of Voting Power. If you vote for me as a witness, you can get my little vote.
@tipu curate
Upvoted 👌 (Mana: 4/6) Get profit votes with @tipU :)
Thank you very much for your support.
Thanks for the post. It was very impressive.
Your article is very good. Nicely explained about Bullish Divergences . I hope you write articles like this in the future.Thank you.