新冠病毒数据新闻与可视化作品赏析(2)
南华早报 :Coronavirus: the new disease Covid-19 explained
《南华早报》是一家香港的媒体,在信息可视化领域有很强的实力,获得过2018“信息之美”获突发新闻金奖。这次新冠疫情,南华早报制作了一系列的数据新闻和可视化报道,非常专业非常震撼。让我有发现了宝藏的感觉。
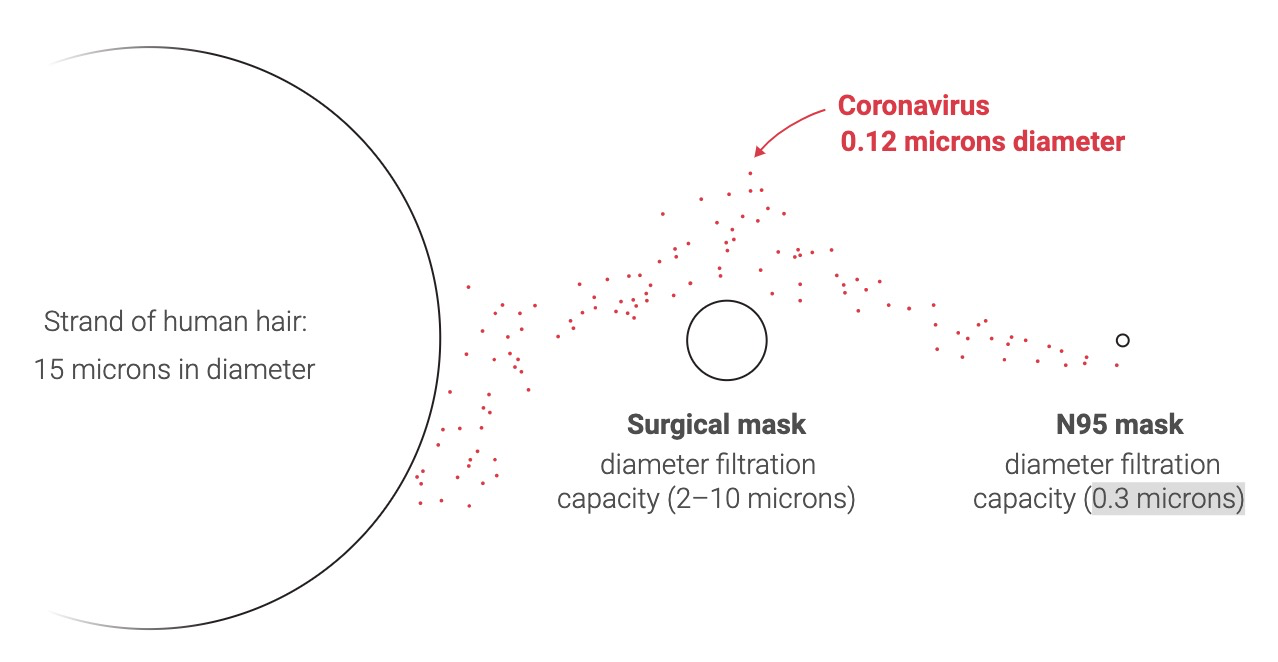
Coronavirus: the new disease Covid-19 explained是目前为止,最棒的关于新型冠状病毒的可视化 & story telling。用最简单的设计、最通俗易懂的方式传递最有用的信息, 更着重讲解知识和事实,更讲究贴合主题的设计,传达一定观点。 除了简单高效的可视化图外,整个 story telling 非常完整,面面俱到。
- 人头发 V.S. 外科口罩 V.S. N95 口罩 V.S. 新冠病毒直径比较:
- 中国封城人口 V.S 其它国家人口总数
- 钻石公主号

- 医务人员
- 症状和并发症
除了上面介绍的一篇外,还有其它很多用图形、可视化的方式做的新闻和 story telling。譬如这篇:Coronavirus: community outbreak in Hong Kong,用的数据很基础,但是别处心裁的视觉效果,让人影响深刻。(因为我尝试过分析类似的数据,只能想到折线和柱状图,( ╯□╰ ))
澎湃:763例确诊患者的故事,还原新冠病毒向全国扩散的路径
澎湃美数课是国内继财新后最强的数据新闻团队。
这次新冠疫情报道,澎湃拿出了多篇高质量的数据新闻作品。澎湃的报道更多着眼于数据背后的洞见。 这篇作品用到的可视化工具包括,QGIS,Processing和Adobe Illustrator 。


#cn-reader #steempress #hive-180932 #sct #sct-cn #sct-freeboard #palnet #zzan #dblog #diamondtoken #marlians #neoxian #lassecash #upfundme #busy #actnearn
Congratulations @huangzuomin! You have completed the following achievement on the Steem blockchain and have been rewarded with new badge(s) :
You can view your badges on your Steem Board and compare to others on the Steem Ranking
If you no longer want to receive notifications, reply to this comment with the word
STOPTo support your work, I also upvoted your post!
Do not miss the last post from @steemitboard:
Vote for @Steemitboard as a witness to get one more award and increased upvotes!