Let's check the MVRV Z Score and 1m-3m realized cap holder ratio again.
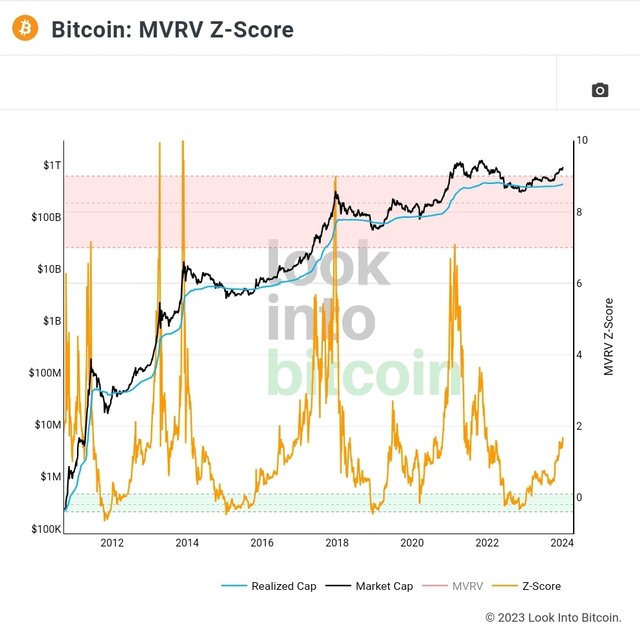
The MVRV Z Score is the best BTC(Bitcoin) on-chain data I've ever seen. Now, it's around 1.7. As you can see the chart, when it broke 2.0, the BTC price had a price correction or sideways. I think we have extra score left 🥹 I think now is ok
Since all spot BTC ETF(Exchange-Traded Fund)s were approved, the BTC price is potential to grow. This event is not temporary. I expect that many people will mistake selling BTC before touching 2021's ATH(All Time High).
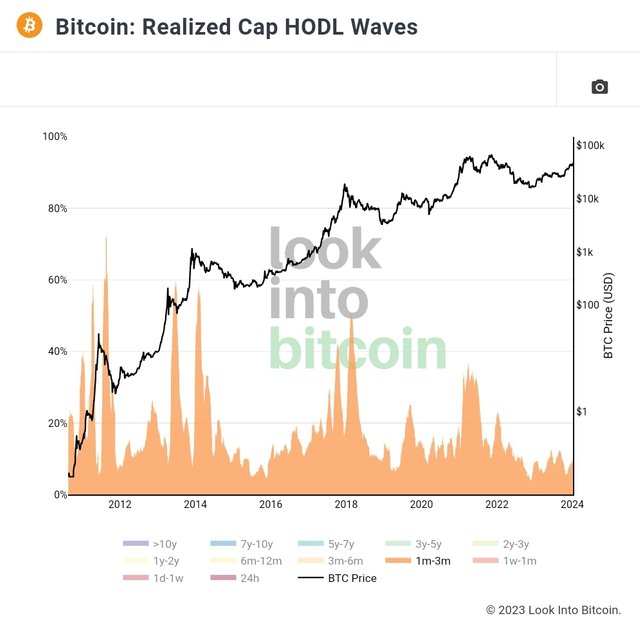
Alright, let's take a look at the realized marketcap 1m-3m holder ratio. The reason why I choose 1m-3m holder ratio is that the ratio indicates the most accurate time for market conditions.
When the ratio broke 17%, the BTC price had a price correction or sideways. Now, the ratio is around 10%. It doesn't seem to be overheating yet.
Someone said "$ell the news." I think it's gonna be a stupid thing with respect to long-term investment. Spot BTC ETFs mean money flow into the crypto market for a long time.
See the bigger picture
This comment is for rewarding my analysis activities. Upvoting will be proceeded by @h4lab