Bitcoin TA - summary of analysts - 25. May 18
Regular daily update on BTC ta analysts opinions.

**My summary - short-term sentiment: slightly bearish ** (last: bearish)

- Critical support seems to be 7'000 - 7'200. This level needs to hold or analysts expects prices below 6'000 soon.
- Some analysts turned bullish seeing 7'200 as bottom and swing low.
- May is usually a strong month. Lets see how it plays out in 2018.


News about the blog
I need to revise my 2018 long term table. I need to add a 2018 and 2019 target an be more precise on the sentiment here. Will do that after I am back in Switzerland.
We lunched the bounty project beta. If you are interested and you like to create a bounty on your own have a look at this post
Analysts key statements:
Tone:
- Weekly:
general: Sees strong similarity to 2014 but current environment is even weaker. As we haven't made it above 30 MA and did not bring the 7 MA back above the 30 MA. Instead we are approaching the 50 MA.
In 2014 we dropped 87% - That would give us a target of 2'570. Just for awareness that this correction might not be at its end yet.
We had worse weeks but still it looks bad. We probably close below 50 MA. We spend too much time in the 7'500-7'600. That we bounce from 6'000-6'500 he sees as very unlikely. That we see 10'000 soon is very unlikely. The best case is we go up to 8'000 where lot of people might go to cash or even short bitcoin.
@haejin:
Bitcoin ABC (red) correction. The red C wave thus far seems to have red waves 1,2,3 complete and currently putting in wave 5. This would mean one more lower low is likely.
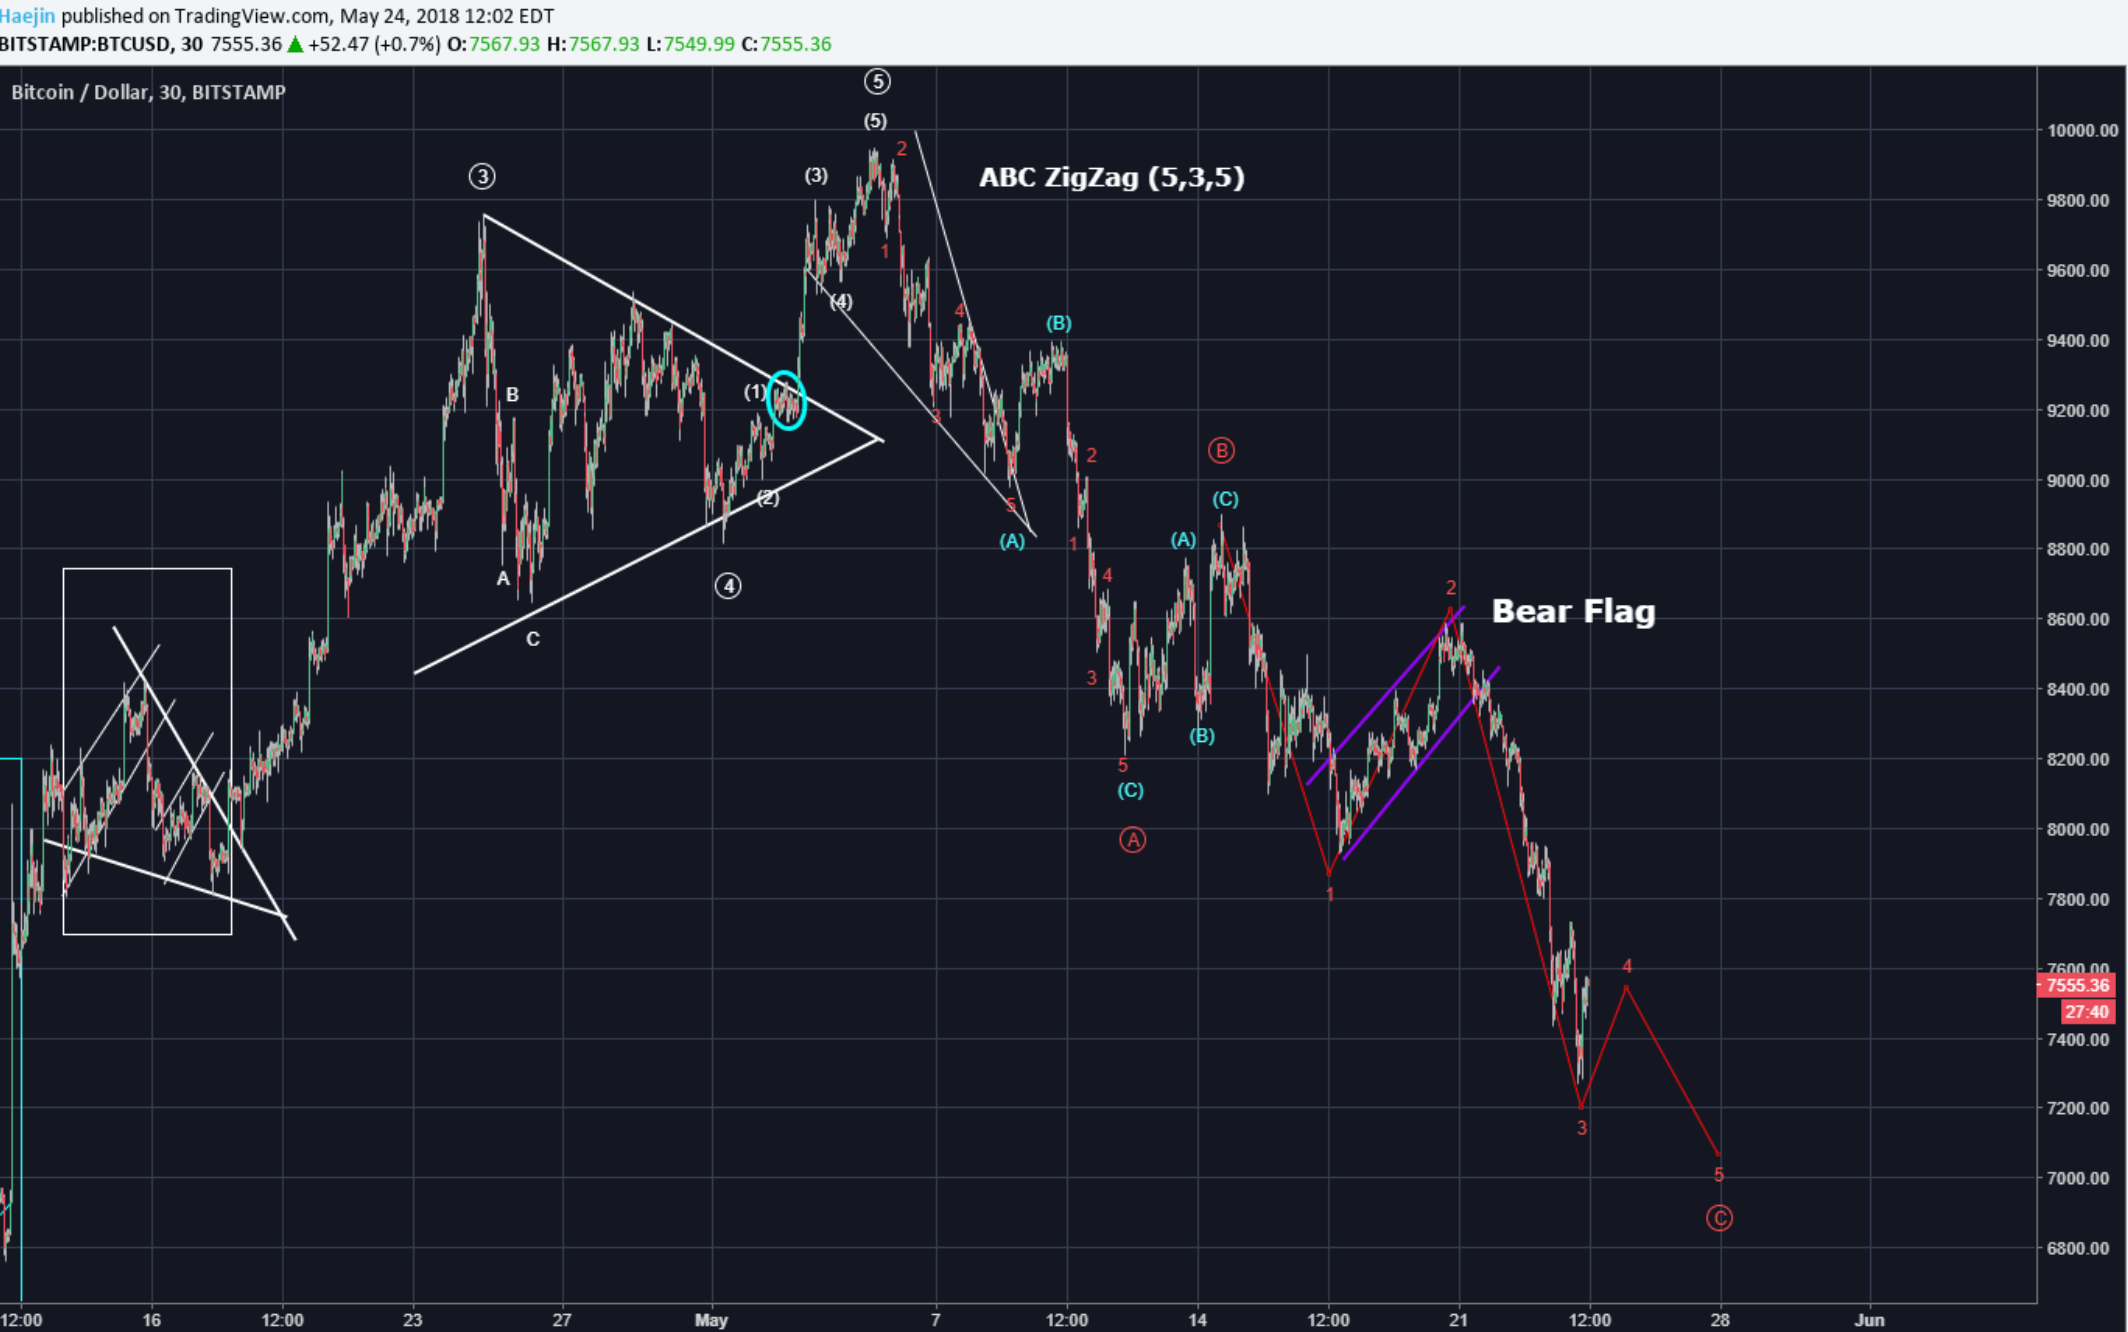
The pattern has morphed into a bull flag as shown below. Price is also moving in a channel between two parallel white lines. The red ABC markings show the correction pathway and the red arrow outlines the one more lower low potential. This would then reach to the 0.78 Fib level (blue circle).

@ew-and-patterns:
He thinks the correction is done. We may see one lower low, but I am seeing three bullish patterns in the same wave which is rare.
A popgun, a bullwick and a "M" formation which might actually also be a "bullish butterfly pattern" on the 5min chart.
He also think this an extended 5th. All this turns him bullish for BTC and altcoins.
@lordoftruth:
He has two scenarios:
Primary Scenario (A) - Bitcoin price should not drop below 78.6% Fib at 7'210 of the prior April to May advance and ready for a climb to eventually break the key level at 10'158.
Second Scenario (B) If 7'210 level breaks (daily close), the bearish development will lead the price below 5'947.
Todays trend is neutral. Trading between 7'210 and 8'175.
@philakonesteemit:
Bullish scenario: we'll find confluent support at the 0.786 fib region on a small degree, the 0.65 fib region on a very large degree, and the major trend line support established since November, which is between the 7'000 - 7'300 range.
Bearish scenario: we'll break through 7'000 and test 6'500. If it fails to bounce bitcoin, we may see 5'000 ranges.
@passion-ground:

Unless we get a bullish reversal soon, chances of a retest of the last pivot low at 6'611 and thereafter a retest of April's 6'427 low, and then lastly a retest of the current bear market low of 5'920 shall continue to increase.
Looking for a bullish 5-wave impulsive reversal to the upside to mitigate the current downtrend, and raise prospects for a most bullish 3rd wave advance. Until we see such, the bearish downtrend is likely to persist until it finds meaningful support.
Summary of targets/support/resistance


Reference table
| analyst | latest content date | link to content for details |
|---|---|---|
| Tone Vays | 24. May | here |
| @haejin | 24. May | here |
| @ew-and-patterns | 24. May | [here]https://steemit.com/btc/@ew-and-patterns/btc-update-24-05-18) |
| @lordoftruth | 24. May | here |
| @philakonesteemit | 24. May | here |
| @passion-ground | 24. May | here |
Definition
- light blue highlighted = all content that changed since last update.
- sentiment = how in general the analysts see the current situation (bearish = lower prices more likely / bullish = higher prices more likely)
- target = the next (short term) price target an analysts mentions. This might be next day or in a few days. It might be that an analyst is bullish but sees a short term pull-back so giving nevertheless a lower (short term) target.
- support/res(istance) = Most significant support or resistances mentioned by the analysts. If those are breached a significant move to the upside or downside is expected.
- bottom = -> now renamed and moved to long term table. Low 2018
- low/top 2018 = what is the low or the top expected for 2018?
Further links for educational purposes:
- From @ToneVays: Learning trading
- From @philakonecrypto: Like in every post you find links to his amazing educational videos. For example here
- From @lordoftruth: Fibonacci Retracement
- From @haejin: Elliott Wave Counting Tutorial
*If you like me to add other analysts or add information please let me know in the comments.
Nice roundup, thanks for sharing. I've smashed the upvote button for you!
Also, if you are looking to get some tokens without investing or mining check out Crowdholding (https://www.crowdholding.com). They are a co-creation platform were you get rewarded for giving feedback to crypto startups on the platform. You can earn Crowdholding's token as well as DeepOnion, ITT, Smartcash and many other ERC-20 tokens.
your information was really need for us..thanks for info dear
ok, its nice to see all of these combined in one post, (you got a new follower)
I am trading on bitmex myself (just a bit) and am also going short and would confirm the bearish sentiment. it seems the 7500 is not holding so then the low will get lower...
i saw you are swiss. We are a group that also lives in Switzerland and have set up @swisswitness with a server set up here in the mountains
if you could support us with your vote that would be amazing. we are looking to set up another backup witness as well but would need a few more votes like yours to break even.
thanks in advance for your consideration
The post helped me a little in understanding this whole world, it is good to understand this kind of things a good analysis of all this combined in a publication, excellent thanks for the information