Bitcoin TA - summary of analysts - 23. June 18
Regular daily update on BTC ta analysts opinions.

**My summary - short-term (next 24h) sentiment: bloodbath ** (last: bearish)

Bearish scenario (preferred):
Price broke through 5'945 (wedge).
We moves below last stronghold - the low of Feb 5th - 5'945 and have a close there.
After breaking 5'945 we see panic and a significant drop towards new lows in the range of 4'975 and 3'100.
Bull scenario (unlikely):
We bounce from this level having a double bottom at 6'000.
We go up to the top of the triangle.
- @haejin: He is posting bitcoin only on bitcoin live anymore. I am trying to reach out to him to see if we can have an abstract here.
- Lets see how June plays out -usually also a bullish month. Are we going to see a compensation of May with a huge rally up?

News about the blog
- Bounty project website launched. Are you becoming a bounty hunter? Steem-bounty website.
You find the How-To for creating a bounty at this post
Analysts key statements:
Tone:
- Weekly: His target is still 4'975 in first half of July. Price falls faster than he has anticipated. We are on a 6 of 9 and he expects 3 more weeks of downside and might reach the 4'975 in that timeframe. He thinks the "below 4'975" is kicked off with this move.
30 MA and 7 MA are moving down. - Daily: We are on a red 2. We haven't traded below the red 1 for now. We don't see any reversal candle here. If we close in this area we have a lower closing low and lower swing low.
@haejin:
@haejin is moving his analysis to bitcoin live. Those of you who want to follow him directly should look into subscription. I will try to get in contact to see if I can use an abstract to post here also in the future.

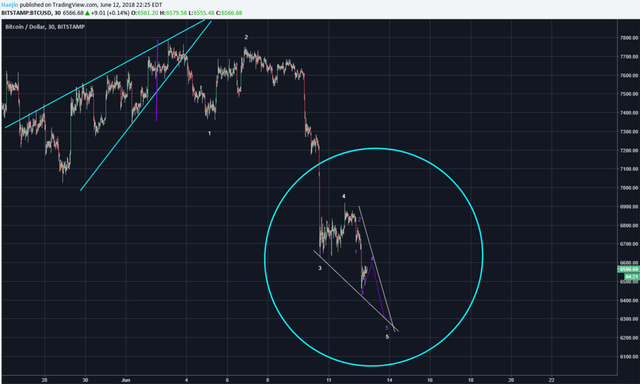
Bitcoin (BTC) Short Term Update: The blue circle shows a potential pricepathway of BTC. The purple waves have been updated and it shows a scenario where purple 1,2,3 could be complete and 4 is getting its final touches. Purple 5 is still targeting the 6'300 zone or so.
@ew-and-patterns:
BTC turned bearish which I expected in my last post. The ABC pattern is finished.
In his best case scenario this is the last wave down:
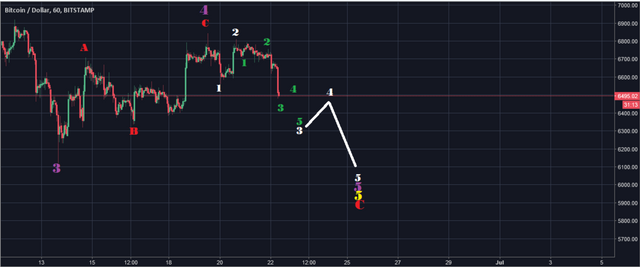
If the drop ends above 5'920, it might still be wave 1 and 2 on a bigger scale. If it drops below 5'920, the next best alternate would be WXYX2Z.
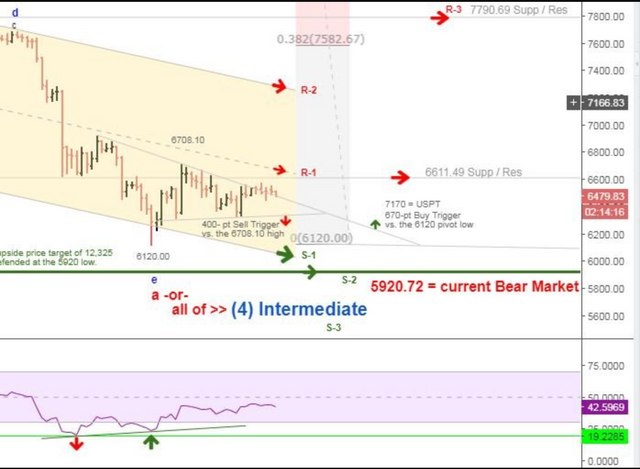
@lordoftruth:
As expected the price of bitcoin broke 6'300 yesterday ( the down border ) of the bearish channel bordered by 6'300 - 6'900 reached 6'039 and went below the past low of 2018 at 5'947.
his first 3 targets were met and for now the way is open towards the next targets at 5'878 & 4'300.
No Change to our bearish scenario, conditioned by the price stability Below 6'900 and when the Accumulated Stops will be triggered below 5'878, the price will accelerate lower, right to our destination at 4'300 Area / Butterfly "Buy"that appears on the below chart, within less than 2 weeks.
Todays trend is bearish. Trading between 5'878 and 6'600.
@philakonesteemit:
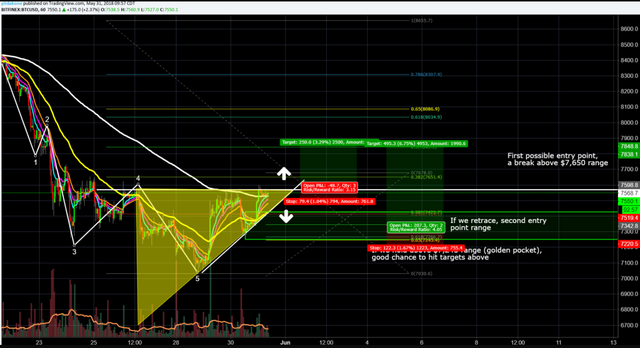
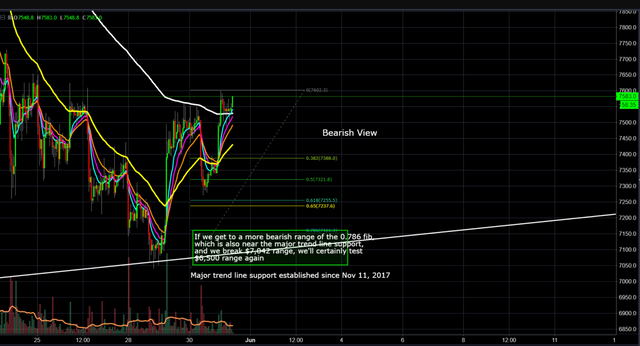
A bounce at the 7'000 level was much expected due to hitting a major trend line support established since Nov 11, 2017.
Bullish View, if we break the 7'650 range, there's a chance to hit 7'850 to 8'000 range (0.5 to 0.618 fib retracement)
Bearish View, if we break 7'161 range, we'll most likely test 7'040, which I see as failing to hold and then testing 6'500.
@passion-ground:
The move up off the recent pivot low has begun to wander sideways. Tonight we present both a bullish and bearish trade set-up for those so inclined to consider such.
We got a price target (iSHS) of 7'170 as long as 6'120 isn't broken.
Sell trigger if 6'331 is cross. Target of 400 downwards so at 5'931.
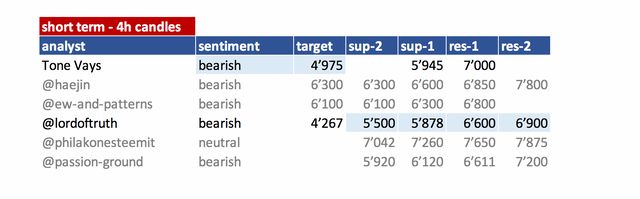
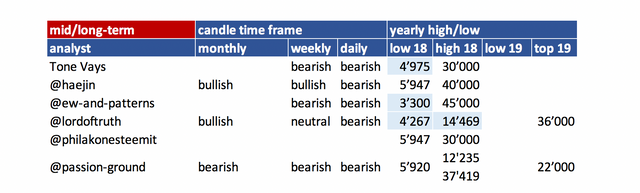
Summary of targets/support/resistance
Reference table
| analyst | latest content date | link to content for details |
|---|---|---|
| Tone Vays | 22. June | here |
| @haejin | 13. June | here |
| @ew-and-patterns | 22. June | here |
| @lordoftruth | 23. June | here |
| @philakonesteemit | 31. May | here |
| @passion-ground | 18. June | here |
Definition
- light blue highlighted = all content that changed since last update.
- sentiment = how in general the analysts see the current situation (bearish = lower prices more likely / bullish = higher prices more likely). The sentiment is based on 4hr, daily, weekly, monthly candle charts.
- target = the next (short term) price target an analysts mentions. This might be next day or in a few days. It might be that an analyst is bullish but sees a short term pull-back so giving nevertheless a lower (short term) target.
- support/res(istance) = Most significant support or resistances mentioned by the analysts. If those are breached a significant move to the upside or downside is expected.
Further links for educational purposes:
- From @ToneVays: Learning trading
- From @philakonecrypto: Like in every post you find links to his amazing educational videos. For example here
- From @lordoftruth: Fibonacci Retracement
- From @haejin: Elliott Wave Counting Tutorial
*If you like me to add other analysts or add information please let me know in the comments.
This is really informative .. thank you for showing your work.
bitcoin hits 12000$ soon till july
of course , it is correct. but on 5 july bit coin result will be showed.
REPLICATION OF 2015 IN 2018
Stop talking about @haejin
Thanks for the information! It's interesting but this from the BTC scares a little
steady analysis @famunger.