Bitcoin TA - summary of analysts - 22. May 18
Regular daily update on BTC ta analysts opinions.

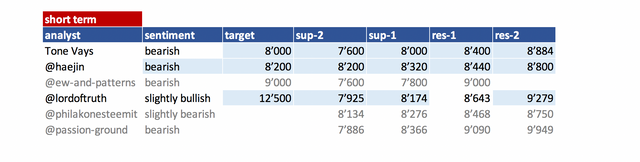
**My summary - short-term sentiment: bearish ** (last: slightly bearish)

We are already back down below 8'400.
It seems analysts are right and we see more downside. All analysts except @lordoftruth see lower targets coming.
May is usually a strong month. Lets see how it plays out in 2018.

News about the blog
I need to revise my 2018 long term table. I need to add a 2018 and 2019 target an be more precise on the sentiment here. Will do that after I am back in Switzerland.
We lunched the bounty project beta. If you are interested and you like to create a bounty on your own have a look at this post
Analysts key statements:
Tone:
- Weekly: Looks very similar to 2014 - we went into 30 MA after bouncing of the 50 MA. In 2014 we had 2 weeks of flat prices following. MACD continuous to go down.
- Daily: Another death cross 128 - 50 MA is expected. No bullish momentum without established higher high (bitcoin over 10'000). His target of 8'000 will be reached just later - moved arrow.
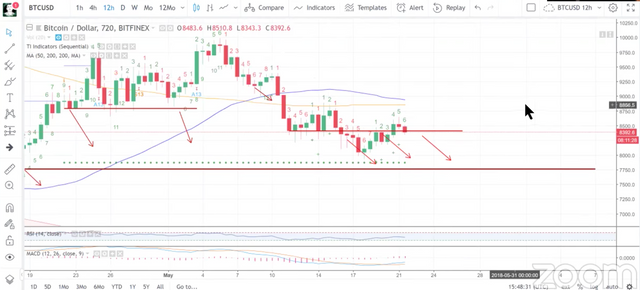
-4hr: Is only chart looking bullish.
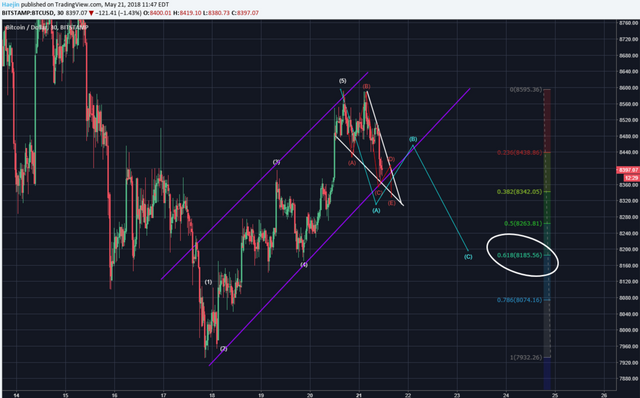
@haejin:
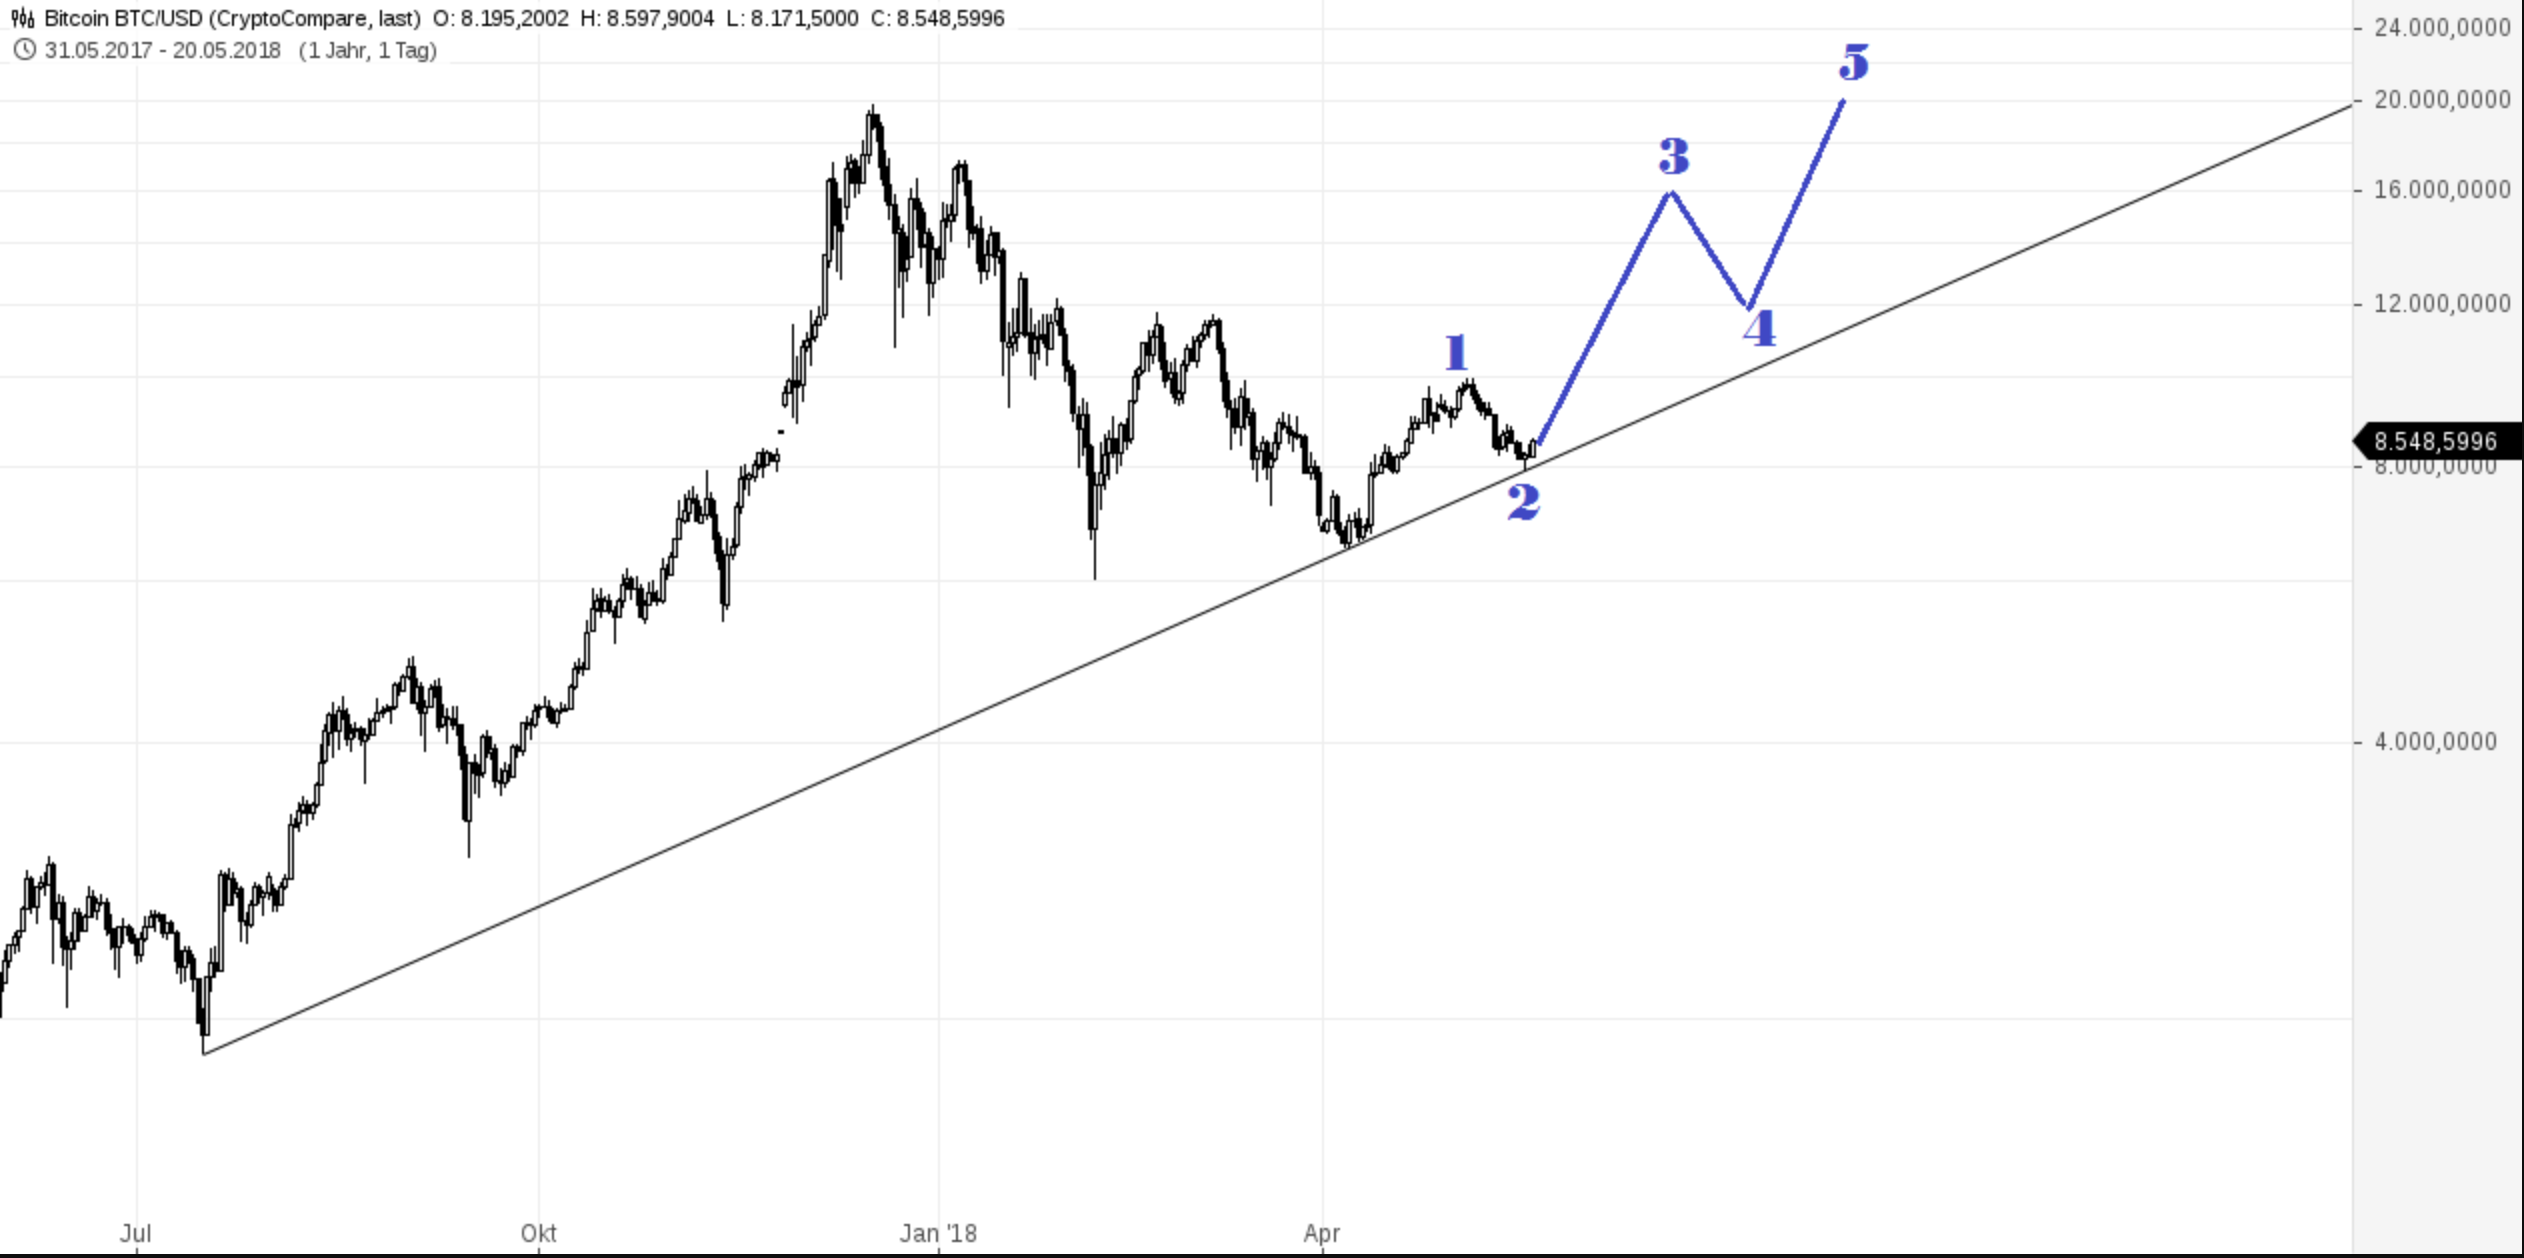
Bitcoin price action has marked out the five wave impulse trajectory. Five waves are followed by an ABC (red) correction. The blue abc are the subwaves of red A and if blue c is complete, a red B wave bounce should occure.
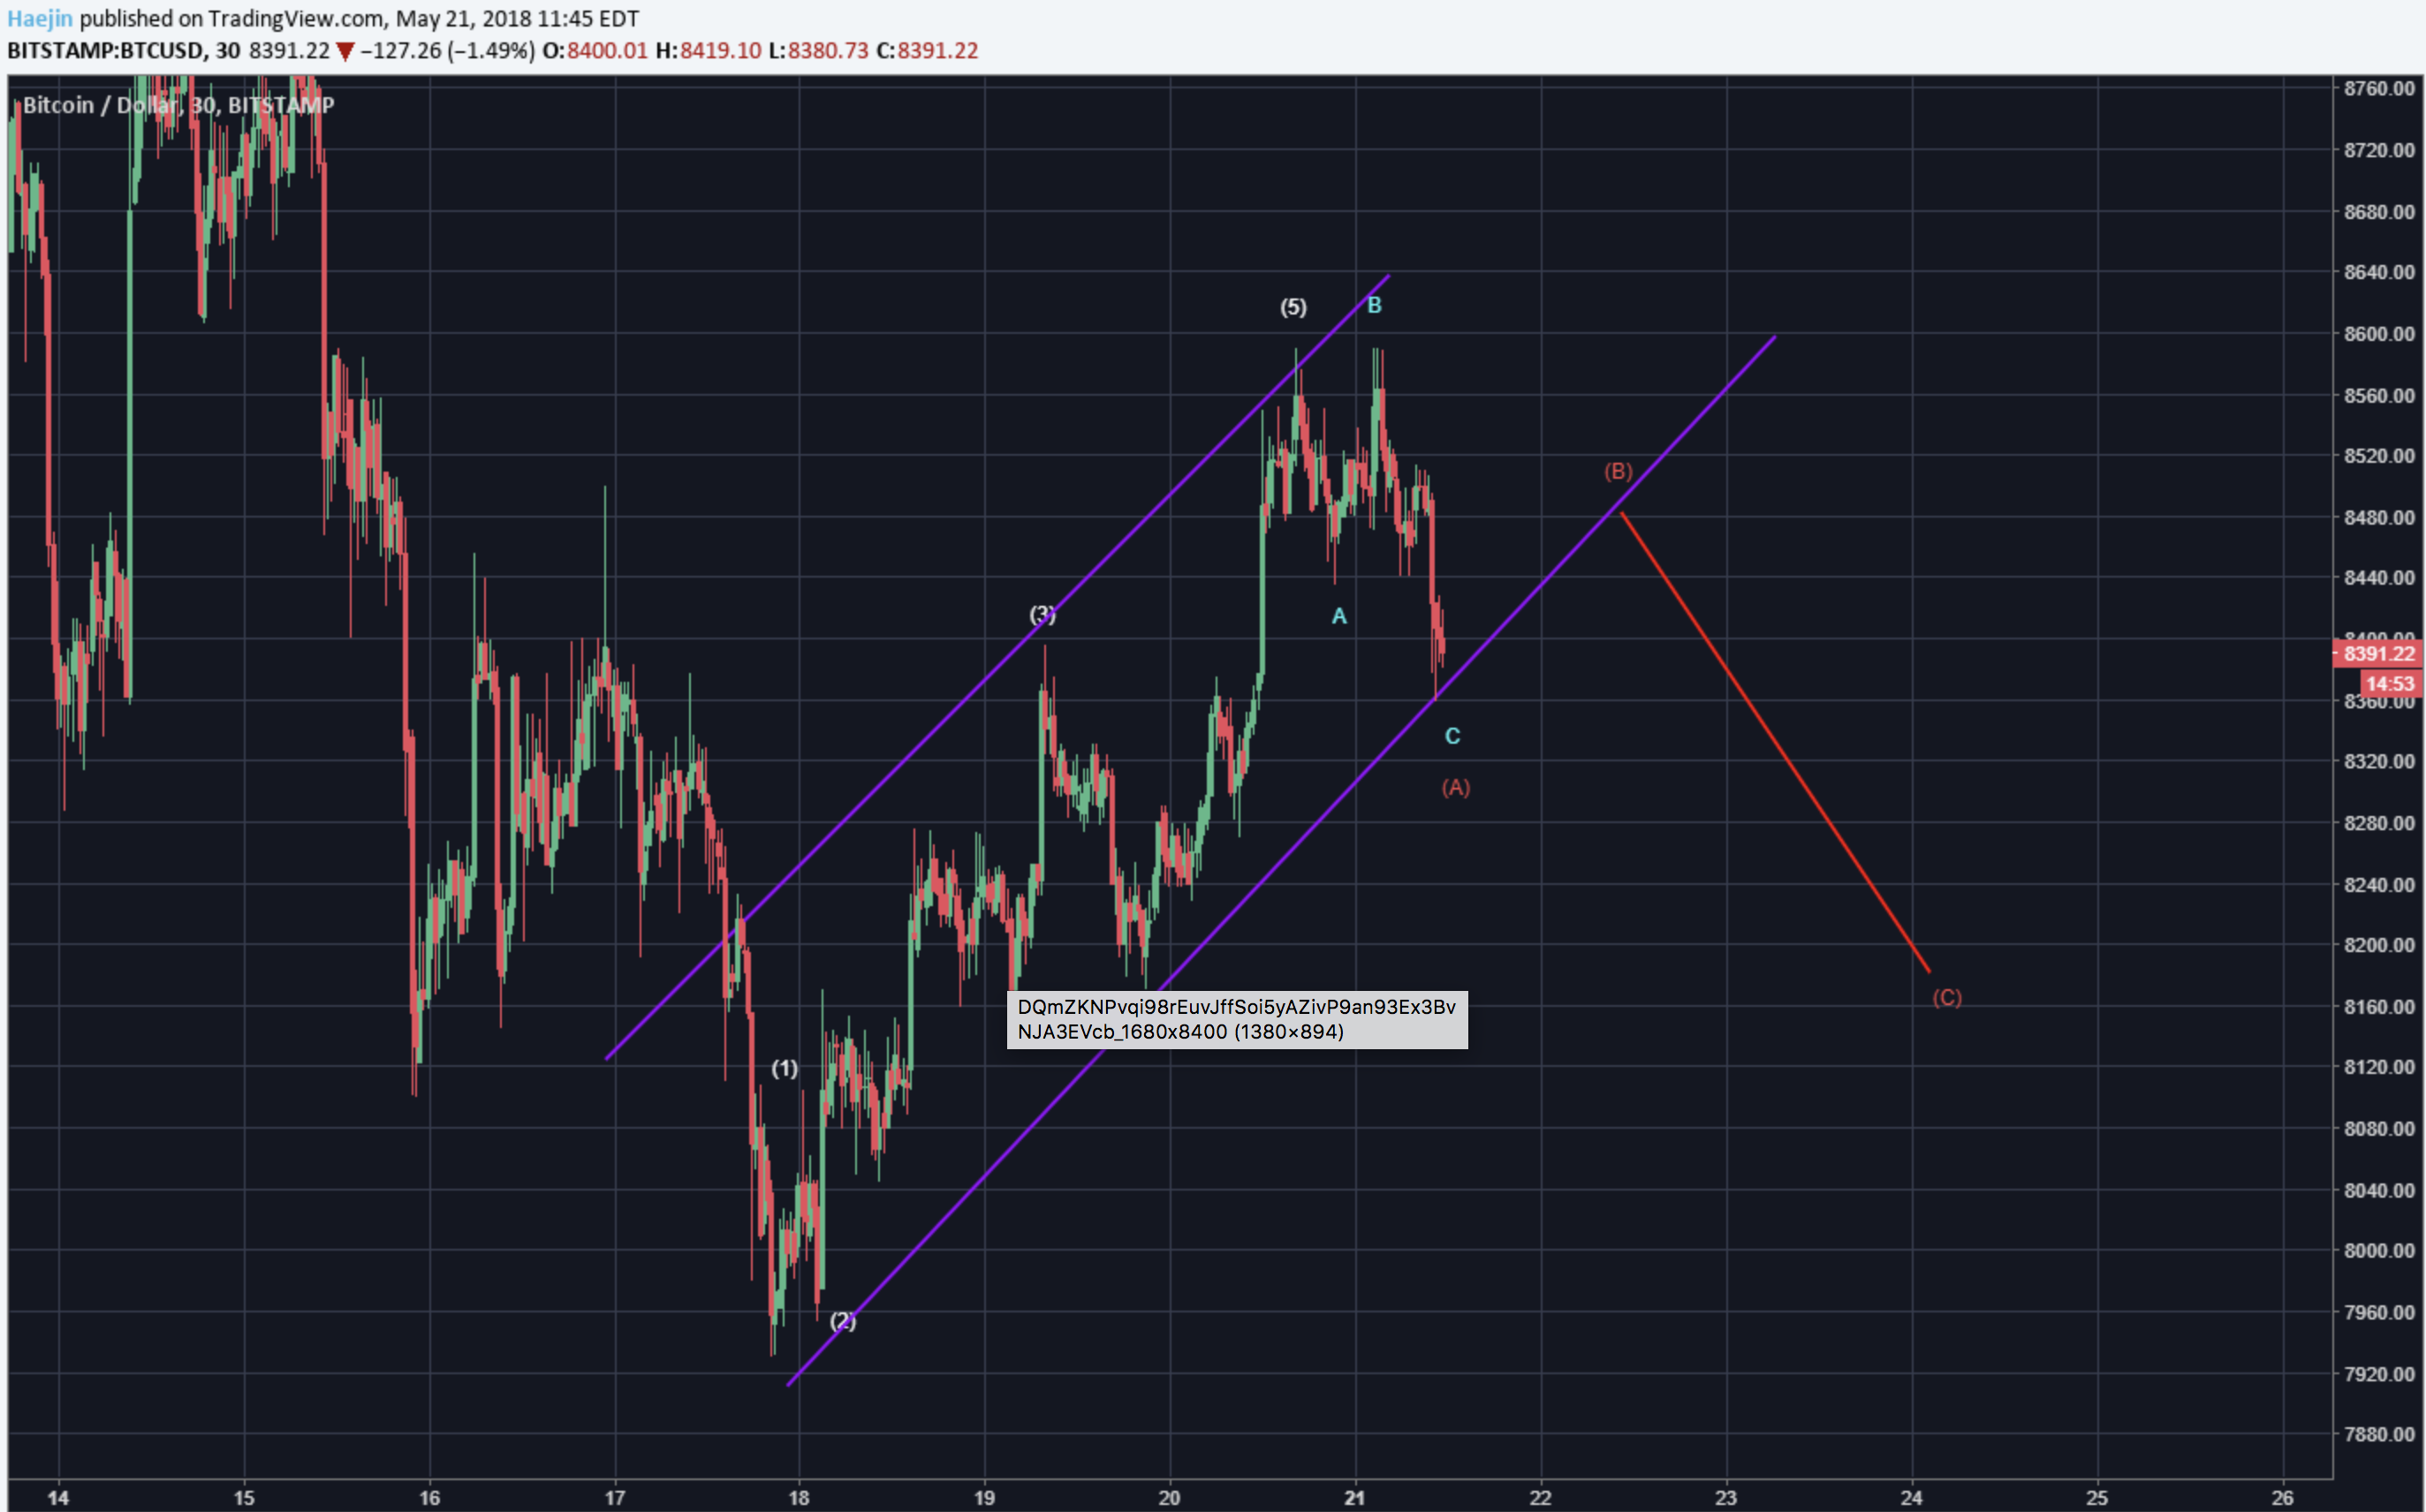
Alternate: The pattern is that of a downward wedge and could represent the full correction (abcde) followed by a breakout to higher highs.
@ew-and-patterns:

This move up looks like a flat correction. He favors the alternate count in brackets (ABC) over the previous ABCDE count. He is seeing three waves down, which means that it can't be the end of the correction.
So if BTC reaches 9000 +-300 and starts crashing hard, see this as confirmation for the ABC count.
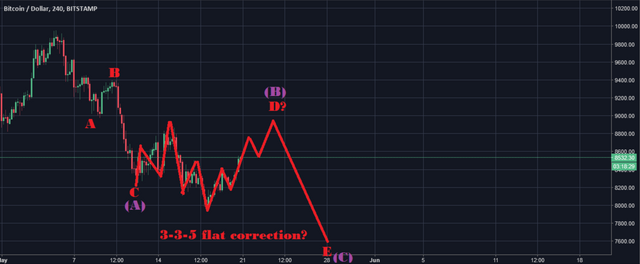
Alternate:
The bounce off this trendline could indicate that the correction is over. He still thinks it is not over though.
@lordoftruth:
Bitcoin price is most likely ready for a rally at this stage (downside limited to 7'925).
He sees to iSHS patterns in the making. One on the 1h and one on the 4H. Both support price target of 11'250.
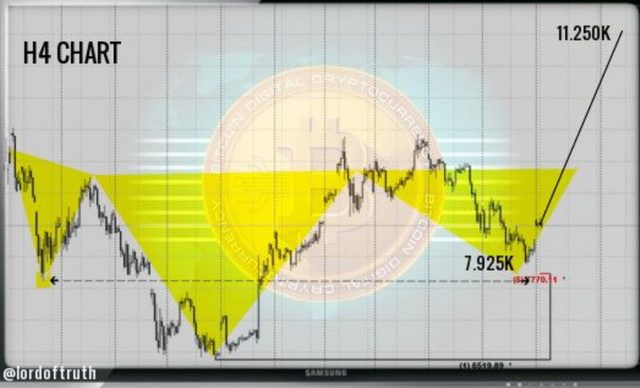
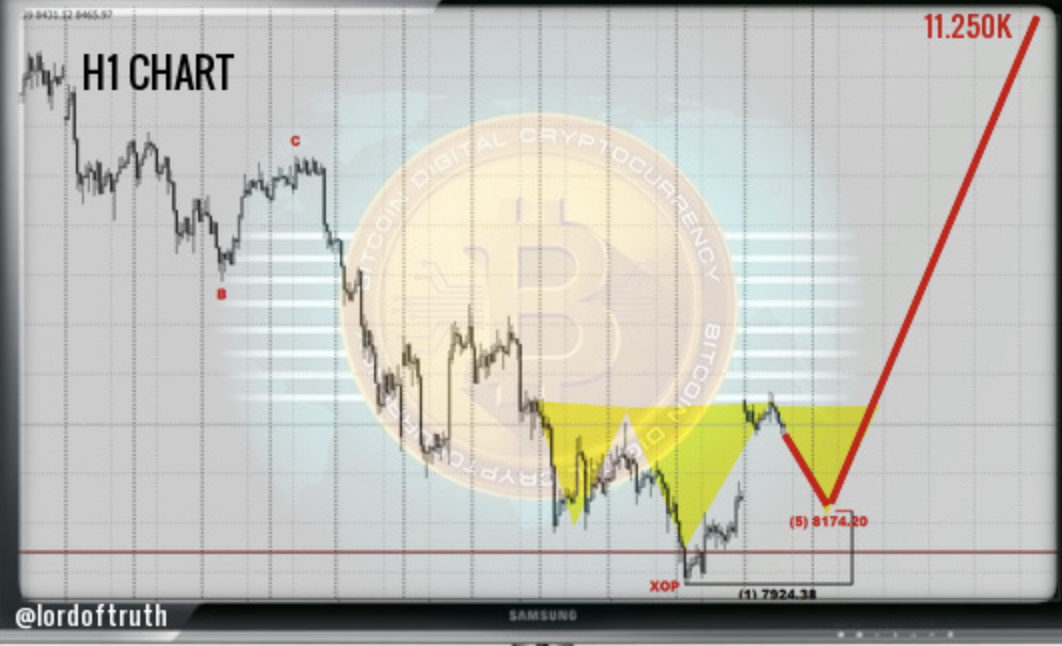
Breaking crucial support 7'770 will invalidate his scenario and lead to decline below 6'519.
Todays trend is slightly bullish. Trading between 7'925 and 8'643.
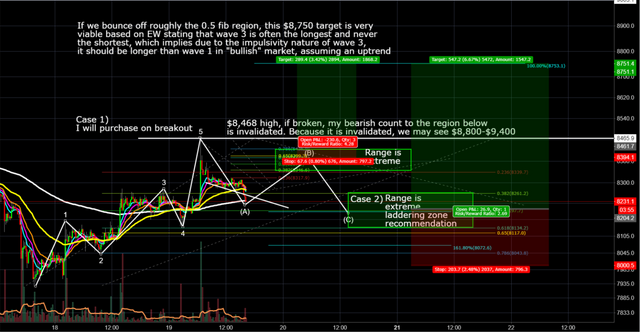
@philakonesteemit:

BTC finishes 5 beautiful waves and has retraced near the 0.382 region thus far.
A break above 8'468 can build a rally to 8'750. A possible B could be in progress very soon, heading up to 8'426 at the 0.786 range before completing C to the indicated range below.
@passion-ground:
The current move up thus far, is clearly corrective… - Unless of course, this modest move higher is a most bullish nested series of 1st and 2nd wave advances. Time will tell, and as such, the utmost in patience and due diligence is required in order to ascertain the true intent and implications of this recent rally off the 7'929 print low.
Summary of targets/support/resistance
Reference table
| analyst | latest content date | link to content for details |
|---|---|---|
| Tone Vays | 21. May | here |
| @haejin | 21. May | here |
| @ew-and-patterns | 18. May | here |
| @lordoftruth | 22. May | here |
| @philakonesteemit | 19. May | here |
| @passion-ground | 17. May | here |
Definition
- light blue highlighted = all content that changed since last update.
- sentiment = how in general the analysts see the current situation (bearish = lower prices more likely / bullish = higher prices more likely)
- target = the next (short term) price target an analysts mentions. This might be next day or in a few days. It might be that an analyst is bullish but sees a short term pull-back so giving nevertheless a lower (short term) target.
- support/res(istance) = Most significant support or resistances mentioned by the analysts. If those are breached a significant move to the upside or downside is expected.
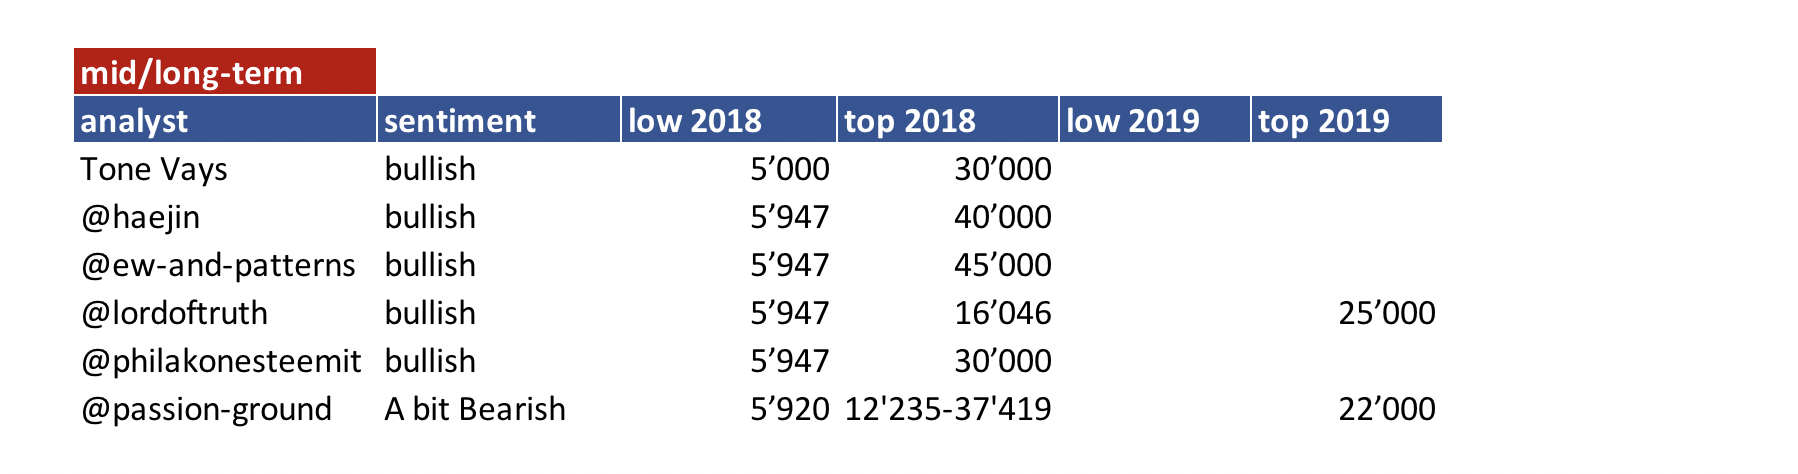
- bottom = -> now renamed and moved to long term table. Low 2018
- low/top 2018 = what is the low or the top expected for 2018?
Further links for educational purposes:
- From @ToneVays: Learning trading
- From @philakonecrypto: Like in every post you find links to his amazing educational videos. For example here
- From @lordoftruth: Fibonacci Retracement
- From @haejin: Elliott Wave Counting Tutorial
*If you like me to add other analysts or add information please let me know in the comments.
Thank you for sharing! The crypto market is very volatile at the present moment and could turn in any direction! In the past 24hrs we have seen price being rejected at the $8,530 region and also closing below the $8,340 level eariler today. I believe we could see a move back towards the $8,000 sometime this week.
That's a great review on daily update news,,Thanks for sharing @famunger
Great work compiling all those analyst, got my follow! Let's see if this bearish momentum doesn't last so much long
Ugh. I want Steem at 4$ :( .. Wanted to withdraw some of my hard earned crypto. Cmon BTC i need a new pair of shoes.. :)
But seriously, the daily volume over the last month on all crypto has spiked so its really hard to predict anything atm. Id say we go by the established knowledge, that crypto sometimes goes up during May/June... Holding my few cents. :D
I am the only one calling for this here...look out below fellas for the best buy you will get in the next few years probably
https://steemit.com/crypto/@heyimsnuffles/breaking-here-we-go-boys-and-girls-one-of-the-only-people-calling-for-this-20180523t160514892z-post