DOW update 02.03.18
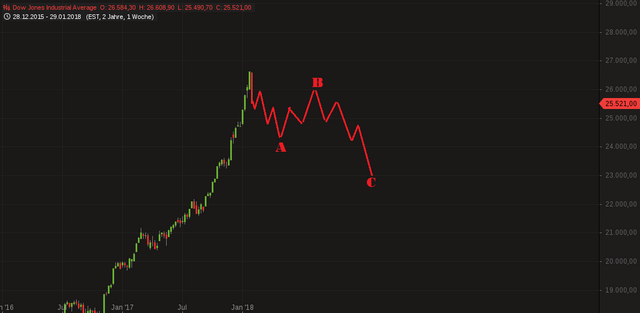
One month ago, I posted this chart of the DOW, expecting a big correction.

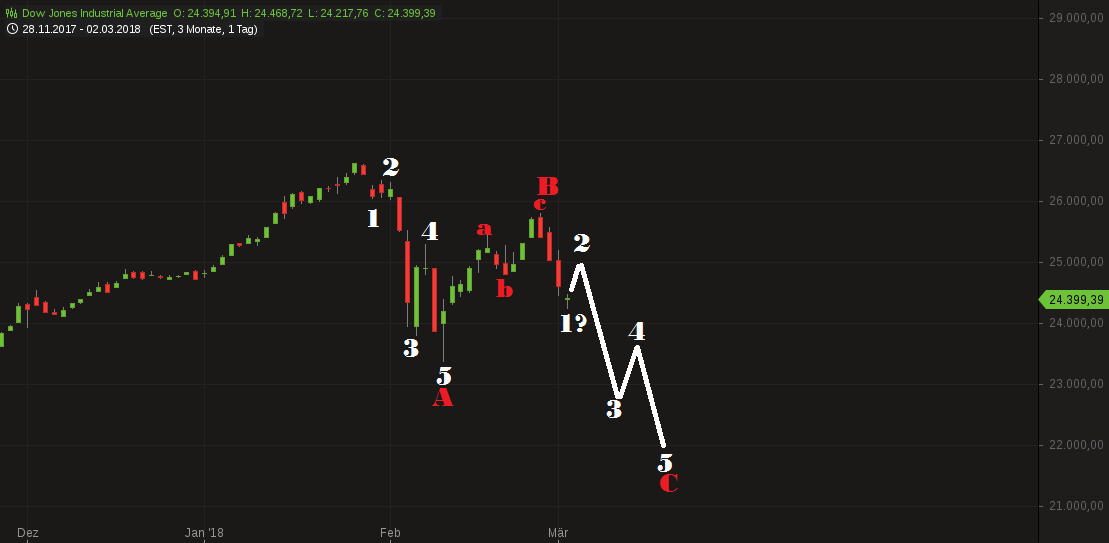
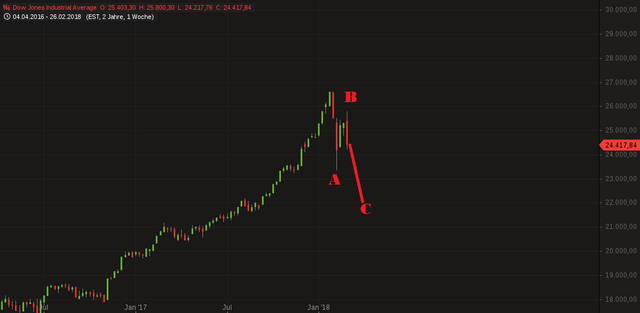
I expected an ABC, 5 waves down for A and 3 wave up for B. I even showed in this picture that it could bounce back up to 26000 before dropping again. Well guess what, we saw all of that. The high of wave B was 25830...
I must admit that I did not expect it to happen this fast though...


The only part missing of this prediction is the C wave down making a lower low than wave A did. I think this wave C down has already started. I am calling 22500 as the minimum target for this move.
This is one for my archives again...
.png)
If you think this to be useful information:

.png)
Feel free to use and share my charts, but please mention me, @ew-and-patterns as the author. Otherwise it is considered plagiarism and I will flag you and advise my friends to do the same.
.png)
MUST READ!
DISCLAIMER: This post / analysis serves general information purposes only. I am not, and never will be a financial adviser. The material in this post does not constitute any trading advice whatsoever. This is just the way I see the charts and what my trading ideas (from my personal experiences) are. I use chart pattern and Elliott Wave analysis for my trading ideas.
For full disclosure: The author of this post is holding positions in this market at the time of this post. Please conduct your own due diligence, if you plan to copy anyones investment decisions!
If you make any trades or investments after reading this post, it is completely in your own responsibility. I am not responsible for any of your losses. By reading this post you acknowledge and accept to never hold me accountable for any of your losses.
Please consider leaving a comment, like or resteem, if this post entertained you or helped you see things differently...
Have a nice day :-)
posts that give me information, thanks
Your (more technical and sophisticated) research would suggest the same as I've been saying. Basically looking at the chart you can see the formation of a blow off top, which is usually followed by a dead cat bounce and then a big fall. I believe we are seeing the begging of the big fall now. Monday should be interesting.
I see you are very good. Expert in this profession. I always adore experts like you. Thanks for the useful information
excellent your post Thanks for sharing i will done up vote
usefull :)
Thanks for your information, very usefully the other people who has joined tranding..
Thanks @ew-and-patterns
Bear market hear we come ;)
TOTALLY, TOTALY AGREE. Check out my post from today.
https://steemit.com/dow/@rollandthomas/don-t-believe-the-market-volmageddon-recovery-hype-part-2
impressive, bullseye!
post was resteemed by @wayforhappiness