Utopian-io Bot v2.0 Analysis : Top 10 Contributed on Projects - Steemit Business Intelligence
Just a week ago, we had updates from @stoodkev regarding the changes made on the utopian bot. Prior to the big delegations, the bot was voting up to 100%.
However, as the number of contributions increased, there were posts not getting voted on. As such, the need for the change.
Let's now look at the effects brought about by this change.
1. Scope of Analysis
Before diving into the details, we will first have a look from which application were the contributions coming from, then which categories had the most number of contributions, the average voting weight given to each category, the average number of votes each category receives, the Github projects that benefited most from the contributions, and then lastly the top 20 contributors of these posts.
- Posts were acquired on Nov. 13, 2017 1612H UTC using steemsql by @arcange.
- There were a total of 413 posts contributed by 138 unique authors.
- Contributions were spread across 84 Github projects.
- Data extracted was from
2017-11-08 11:22:24 AM UTCto2017-11-13 1:23:33 PM UTC.
2. Posts By App
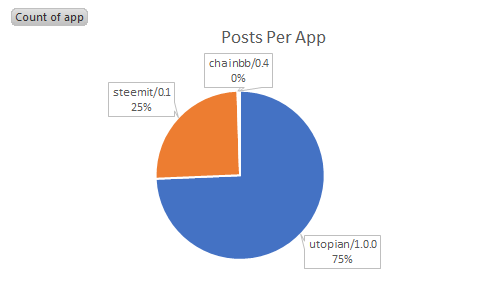
Naturally, most of the posts (75%) were made through the utopian site. Second was through steemit.com (25%), and two posts from busy.org and chainbb.com.
Here are the data in table format:
| App | Post Count |
|---|---|
| utopian/1.0.0 | 307 |
| steemit/0.1 | 104 |
| busy/2.0.0 | 1 |
| chainbb/0.4 | 1 |
3. Contributions Per Category
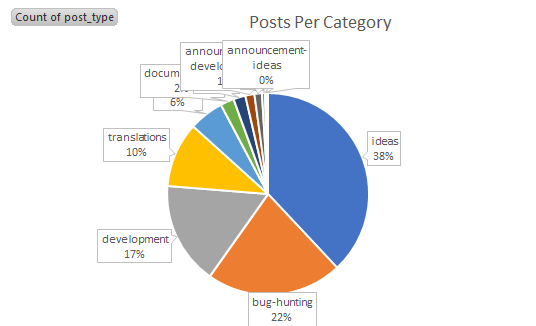
Again, the top category where the contributions were made was in the Ideas (now labelled as Suggestions) with 157 posts (38%). In the previous analysis of utopian-bot version 1.0, there were 277 posts. A good indicator that contributions are now being spread across categories.
Next is "Bug Hunting" with 90 posts (22%). Followed by "Development" with 68 posts (17%).
The least contributed categories are "Social" and "Announcements".
With the roll-out of the new categories we may see a change in the distribution of these contributions.
4. Vote Weight Per Category
Let us now look at the average weight given to each category.
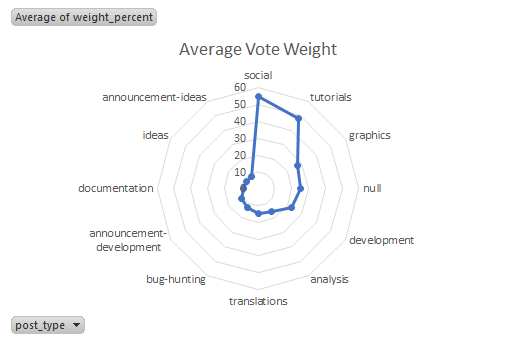
We can see here that "Social" was the category with highest vote weight put on with 55%, followed by "Tutorials" with 48.5%. The lightest voted on category was "Announcements" with 8%.
Again, here are the data in table format:
| Row Labels | Count of post_type | Average of weight_percent |
|---|---|---|
| social | 1 | 55.00 |
| tutorials | 2 | 48.50 |
| graphics | 23 | 27.24 |
| null | 5 | 25.40 |
| development | 68 | 22.75 |
| analysis | 8 | 15.81 |
| translations | 43 | 14.97 |
| bug-hunting | 90 | 12.75 |
| announcement-development | 6 | 11.67 |
| documentation | 9 | 8.78 |
| ideas | 157 | 8.04 |
| announcement-ideas | 1 | 8.00 |
One thing to note here is that "Ideas" (the most contributed upon) has an average vote weight of only 8.04%. This is because of the number of posts in this category. Since we're using average for simplicity, the higher the number of contributions with lower vote weight, the lower the average becomes.
In the next analysis, the author with take this into consideration and look into getting the median of the vote weight instead of the average.
5. Top 10 Github Projects
With the amount of these contributions, let's look at the Github projects that benefited most from these contributions.
Due to the number of Github projects (84 github repositories) contributed on, I've trimmed it to the top 10 repositories where these contributions were directed to.
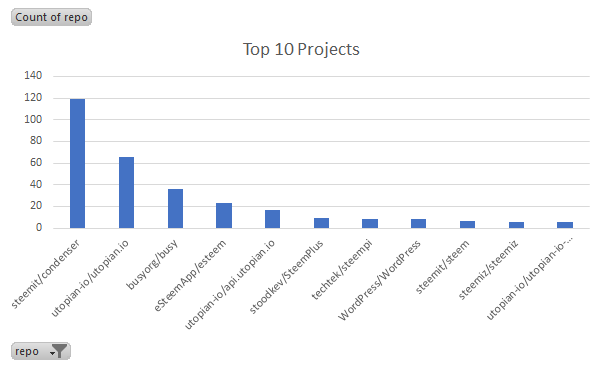
The top most site where contributions were directed to was on steemit.com (github repository steemit/condenser) with 119 contributions (39%). Followed by utopian-io with 66 contributions (22%). And third by busy.org with 36 contributions (12 %).
Here are the data in table format :
| App | Post Count |
|---|---|
| steemit/condenser | 119 |
| utopian-io/utopian.io | 66 |
| busyorg/busy | 36 |
| eSteemApp/esteem | 23 |
| utopian-io/api.utopian.io | 17 |
| stoodkev/SteemPlus | 9 |
| techtek/steempi | 8 |
| WordPress/WordPress | 8 |
| steemit/steem | 7 |
| steemiz/steemiz | 6 |
| utopian-io/utopian-io-landingpage | 6 |
6. Conclusion
In this analysis, we saw that contributions were made mainly using the utopian.io site. And that the most contributed on category was still "Ideas". We also know that this category is now the "Suggestions" category.
We also learned that the category with heaviest vote weight was the "Social" category and have encountered an issue with using average instead of median.
And lastly, we've learned that the most contributed upon project is Steemit's steemit/condenser. An indication that a lot of people have a lot of things they want to improve in the site and that though even they are using utopian.io as the main site to submit their contributions, they still want or are focusing on improving the official steemit site, perhaps of their familiarity with it.
7. Your Thoughts?
What are your thoughts about these? Do you see Steemit, Inc. prioritize on fixing the site, or do you see them focusing on SMTs? Given the announcement by @ned that the team has grown (if I remember it right, around 40), will it be a split of efforts on these two projects or a focus on one? What do you think will be the implications if they focus just on SMT? Share your thoughts in the comments below.
I am part of a Steemit Business Intelligence community. We all post under the tag #bisteemit. If you have an analysis you would like carried out on Steemit data, please do contact me or any of the #bisteemit team and we will do our best to help you...
You can find #bisteemit on discord - https://discordapp.com/invite/JN7Yv7j
Open Source Contribution posted via Utopian.io
Thank you for your insightful analysis @eastmael. Contribution accepted.
[utopian-moderator]
You can contact us on Discord.
Thank you @mooncryption. And congratulations on becoming a utopian moderator. Elear needs all the support he can get.
Thanks @eastmael :)
I love radar chats, but never find the right data to use them with. Well done on this post
Thank you. One thing I found out is when I use the same type of chart, it gets boring as I read the post.
So to insert some kind of surprise, I experimented with other charts. :D
Nice, superb analysis and data analytics. Some great data to analyze. Regarding the development of Steemit and SMT. Watch this starting at 4:18:56
on Steemfest 2 last week I think? was watching the livestreams. There was a developer panel of Steemit and you will know the latest developments they are making. Hope this helps the questions on your conclusions. They also announced a mobile app wallet they are gonna release. I recommend you to watch lots of exciting things they are working on :)
Thank you for forwarding this video bro! You're highly appreciated.
Hey @eastmael I am @utopian-io. I have just super-voted you at 9% Power!
Suggestions https://utopian.io/rules
Achievements
Up-vote this comment to grow my power and help Open Source contributions like this one. Want to chat? Join me on Discord https://discord.gg/Pc8HG9x