Bitcoin price analysis January 22, 2018

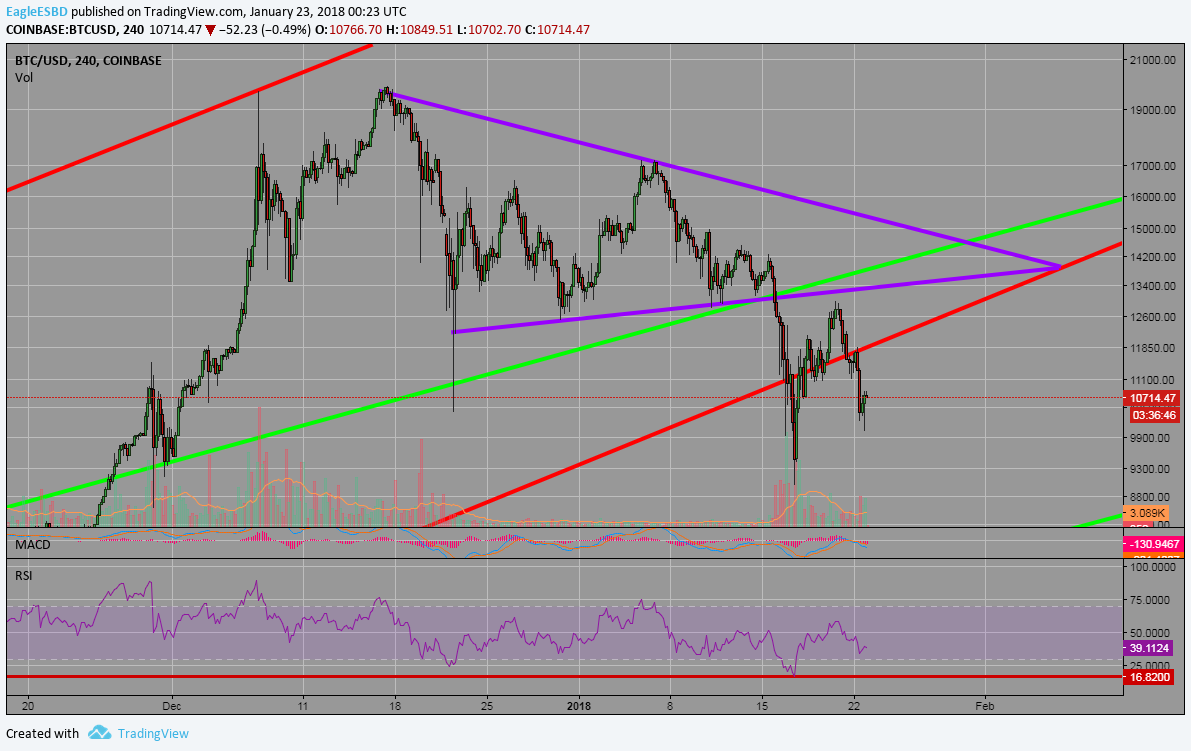
Since December 17, 2017 Bitcoin has been in consolidation. If Dec 17th sounds familiar that's because that is the day the CME launched it's Bitcoin Futures trading market. That low on Jan 17th corresponds with the first futures expiring. Seems Wall Street wanted to let the Bitcoin world know (or think) they are in control. So where do we go from here?

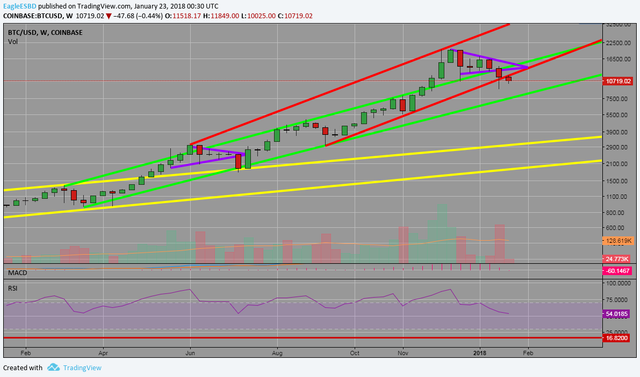
If you read my last report, I pointed out that Bitcoin maybe moving out of the green trendlines and forming new trendlines noted in red. I have made adjustments to the red trendlines as I said I would when more data came in. I'm still long term bullish on the price, but how long until we get some relief from this correction?
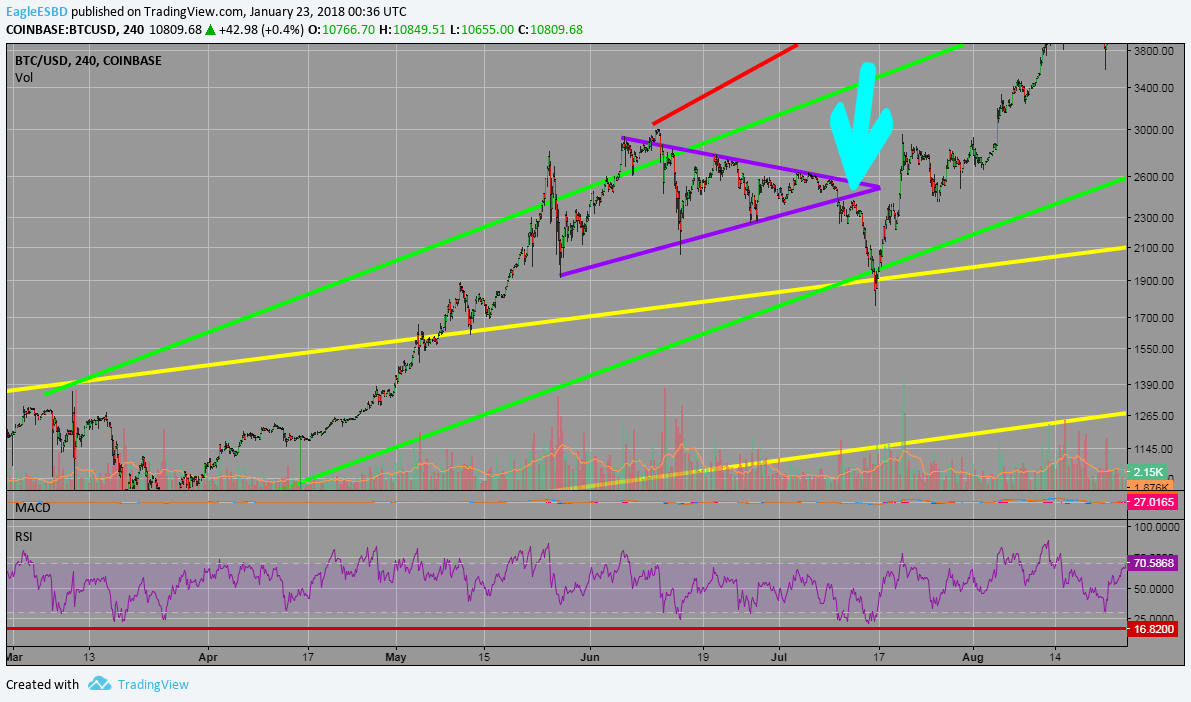
If you look, there was a similar correction in Jun and July at the same time that Bitcoin was shifting out of the yellow trendlines and into the green trendlines. Let's see what happened in July 2017.

On June 11th, Bitcoin formed a top after breaking the yellow trendlines. It then formed a symmetric triangle and had a bearish break to the downside forming a low July 16th before rallying to all time new highs over 6.5x it's $3000 high over the next 6 months. Take a look at the point marked with the arrow and let's go back to where we are today.

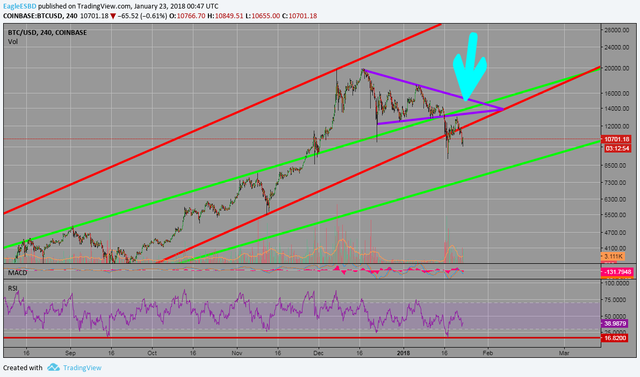
Scroll back and forth to ensure that you are in fact seeing a different image. The similarities to the Jun/July correction is uncanny.
Similarities
Dec's top is 6 months and 1 week from June's top. June/July's correction lasted 1 month and 5 days, today marks 1 month and 5 days from Dec's top. On both times the price rallied to touch the bottom trendline of the symmetric triangle and was rejected. (Marked by the tip of the arrow in both cases).
Differences
June/July's correction bounced off the top of the “old” trendline whereas Dec/Jan's correction is below the “old” trendline. June/July's break was near the tip of the triangle whereas Dec/Jan's break was near the middle of the triangle.
History never repeats exactly, but it usually rhymes. Although the patterns aren't exact, they are very close. If the patterns do continue to align with each other, then we expect Bitcoin's price to hit around $7500 sometime within the next week before rallying to resistance of around $14,000 in mid-February before breaking out to a new 6 month run to probably past $100K.
Personally
I've held even though I was suspicious at the top but didn't have the courage to to sell on my intuition. Now even though I suspect a further short-term decline, I'm still holding because I believe reward is much more heavily weighted than risk at this point. Good luck trading!
Nicely done dude. Keep it up
Good analysis.Thanks for letting us know.
If you like you can go through my blog and also comment on my last post and / or vote😊
Thanks for the analysis and providing some perspective. I too think that the downtrend is still here but the long term continues to look positive as long as fundamentals remain intact.
Nice and realistic analysis. Nice to see some reasonable interpretation of the facts without an abundance of emotion and blame game for who or what is responsible for the decline. Time will prove Bitcoin to have true value.
Congratulations @eagleesbd! You have received a personal award!
Click on the badge to view your Board of Honor.
Do not miss the last post from @steemitboard:
Congratulations @eagleesbd! You received a personal award!
You can view your badges on your Steem Board and compare to others on the Steem Ranking
Vote for @Steemitboard as a witness to get one more award and increased upvotes!