[Alligator Indicator] - Crypto Academy / S5W3-Homework Post for kouba01
.png)
1. Discuss your understanding of the use of the Alligator indicator and show how it is calculated?
2. Show how to add the indicator to the chart, How to configure the Alligator indicator and is it advisable to change its default settings ?. (Screenshot required)
3. How do we interpret this indicator from its 3 phases: the period of rest(or sleep), awakening, and the meal phase?(Screenshot required)
4. Based on the layout of its three moving averages that make up the Alligator indicator, how can one predict whether the trend will be bullish or bearish (Screenshot required)
5. Explain how the Alligator indicator is also used to understand sell / buy signals, by analyzing its different movements.(screenshot required)
6. Do you see the effectiveness of using the Alligator indicator in scalping trading style? Explain this based on a clear example.(Screenshot required)
7. Is it necessary to add another indicator in order for the indicator to work better as a filter and help get rid of unnecessary and false signals? Use a graph to support your answer.
8. List the advantages and disadvantages of the Alligator indicator:
9. Conclusion:

1.Discuss your understanding of the use of the Alligator indicator and show how it is calculated?
The alligator indicator was created by the operator and technical analyst Bill Williams in 1995, William’s idea was based on the movement of the crocodile either when it sleeps or when it is still and attacks its prey, since the more it sleeps the more You will be hungry and this peculiar movement is transferred to the market through a technical indicator.
The alligator indicator is based on 3 Moving Average lines that dictate the price reading in previous periods, each one separately. Williams named each line after the elements that make up a crocodile's mouth.
Blue moving average line 13 periods adjusted for 8 periods = Crocodile jaw
Red moving average line 8 periods adjusted for 5 periods = Crocodile teeth
Green moving average line 5 periods adjusted for 3 periods = Crocodile lips.
The alligator indicator was created to visualize patterns through technical analysis that allows us to know the directionality of a trend, its development and the strength of a trend that is happening in the market, this indicator bears some similarity with the bands by bollinger.
The calculation
The alligator indicator is characterized by having 3 Moving Average lines with different colors that provide us with a reading on the graph, but below I will show you how they are calculated.
Average Price (PM) = (Highs + Lows) / 2
Crocodile jaw = MMA of Average Price between 13 periods and 8 periods of displacement.
Crocodile teeth = MMA of the Average Price between 8 periods and 5 periods of displacement.
Crocodile lips = MMA of the Average Price between 5 periods and 3 periods of displacement.
Indicators that have a single moving line can generate false signals, since their readings are delayed or their precision is not adequate, for this reason the precision exercised by the crocodile indicator is extremely high, since its confirmation is in agreement to 3 moving average lines which average in intervals of different periods to give a better reading and to be able to visualize an adequate pattern on the indicator.
2.Show how to add the indicator to the chart, How to configure the Alligator indicator and is it advisable to change its default settings?
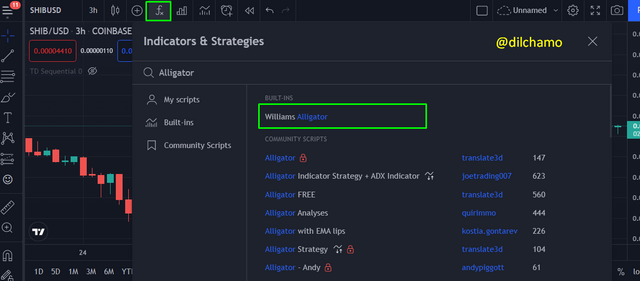
First log into Tradingview. Then when we click on the indicators and strategies icon we can search and get the Alligator Indicator.
Then to customize the indictor settings we can go to indicator settings and then a dialog box with settings will appear. There in the inputs tab we can see the default data given.
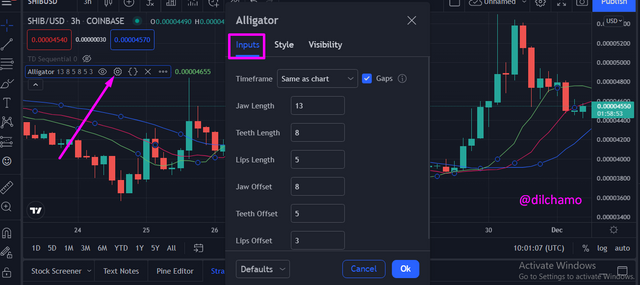
In my opinion I think the default settings can be changed by someone who is more knowledgeable in trading with indicators. But for beginners I think they should follow the default data.
3.How do we interpret this indicator from its 3 phases: the period of rest (or sleep), awakening, and the meal phase.
Rest (or sleep) period
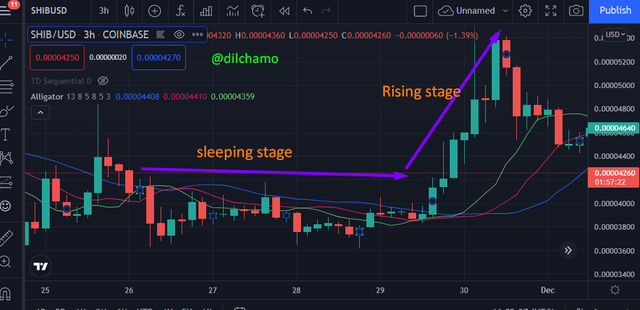
In this first phase the market, as can be seen, is at rest, consolidation or range, according to willians describes this movement as the behavior of the crocodile when it sleeps, since its three characteristic lines are together for a certain oscillating period, at this point it does not There is a clear trend, as the candles are in a constant swing between support and resistance.
When this type of pattern occurs, it is not recommended to enter a position since it is unpredictable to know when the crocodile will wake up and begin to devour in a bullish or bearish way, since the more the crocodile sleeps, the more desire to eat it will have and the more likely it will exist. a change of movement will have.
The awakening and eating phase.
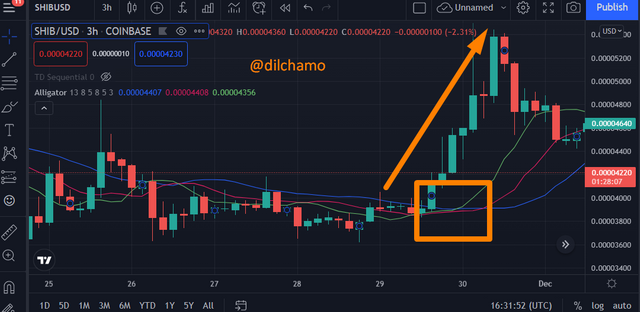
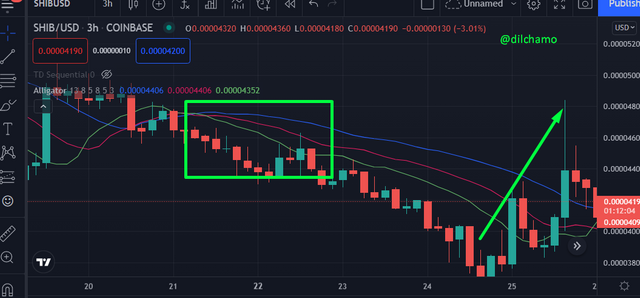
In the following image we can see the awakening of the crocodile indicator, this occurs after its consolidation phase, where the break of resistance or support occurs (in this case resistance), at this point it is a good signal to enter the market for operations. in short or long, (in this case it is long), in its awakening phase we can observe how the moving average lines corresponding to the jaw and lips make a divergence of curves in relation to the crocodile tooth line, in this case the crocodile begins its phase of eating enough to fall asleep.
In the following image we can see the awakening of the crocodile indicator, this occurs after its consolidation phase, where the break of resistance or support occurs (in this case resistance), at this point it is a good signal to enter the market for operations. in short or long, (in this case it is long), in its awakening phase we can observe how the moving average lines corresponding to the jaw and lips make a divergence of curves in relation to the crocodile tooth line, in this case the crocodile begins its phase of eating enough to fall asleep.
In the following image we can appreciate the behavior of the crocodile indicator in its food phase in the market since the moving average lines are in a line divergence, and this will occur until the moving average lines perform a line conversion and we Throw an exit signal from the market and take profit as the crocodile will return to its initial stage or consolidation stage.
4.Based on the layout of its three moving averages that make up the Alligator indicator, how can one predict whether the trend will be bullish or bearish?
The crocodile indicator is made up of the following characteristic lines.
Crocodile jaw = Moving Average Line (Blue) 13 periods and 8 scrolling periods.
Crocodile teeth = Moving Average Line (red) 8 periods and 5 periods of displacement.
Crocodile lips = Moving Average Line (green) 5 periods and 3 periods of displacement.
Next we will appreciate how to visualize the directionality of the trend and its strength through the patterns of its three characteristic lines.
Bullish trend:
To visualize the uptrend, we note a crossing of the BLUE line from top to bottom over the green and red lines, where the blue line will be positioned in the lowest part of the 3 o'clock, and the green line will cross from the bottom up the lines Red and blue positioning above the 3 lines, following this direction the separation of the lines will begin to diverge, which indicates a strong movement, the wider the separation, the stronger the movement, it is advisable to open long positions when starting this movement, or exiting a short position.
Bearish trend:
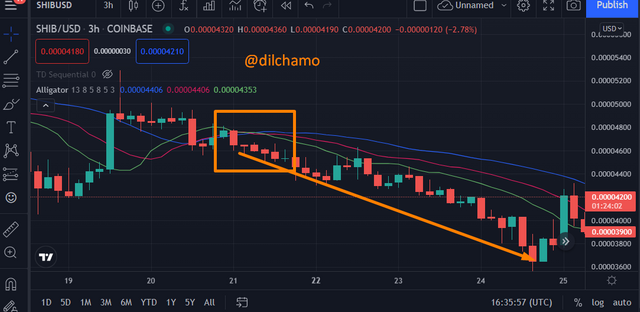
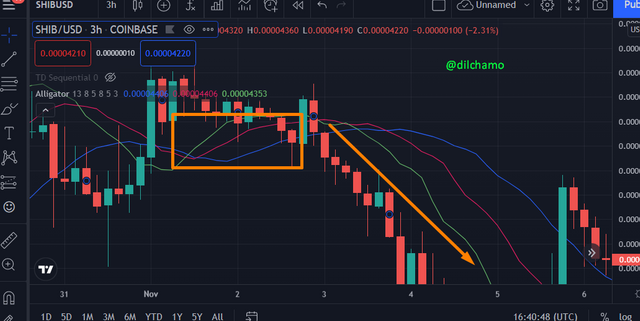
To visualize the downtrend, we notice a crossing of the GREEN line from top to bottom over the red and blue lines, where the green line will be positioned in the lowest part of the 3 o'clock, and the blue line will cross from the bottom up the lines green and red positioning above the 3 lines, following this direction the separation of the lines will begin to diverge, which indicates a strong movement, the wider their separation, the stronger the movement. It is advisable to open short positions when initiating this movement, or exit a long position.
Another movement that can be seen is the movement of the sleeping crocodile and the consolidation stage, where the 3 lines are oscillating laterally, at this point there is no precise definition of the directionality of the trend and entry to the market.
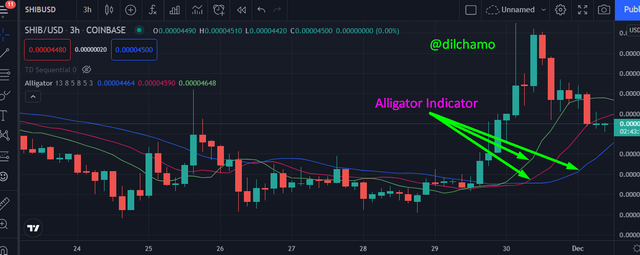
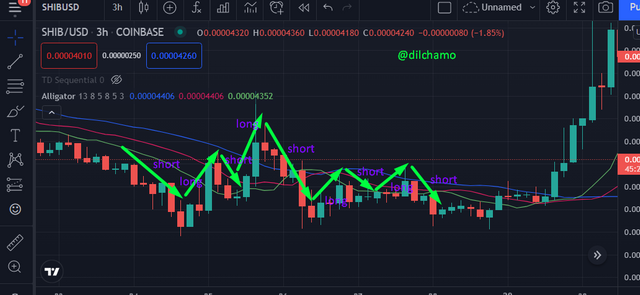
The first signal we see is bullish, because the moving lines start to diverge, and then the green line will be above the other two moving lines and expand a bit. Then we must also see the price of the asset, since it must be above the three moving lines and this can be seen in the graph that once this signal passes, the price begins an upward trend.
Then if we look at this same graph, we are going to find a bearish signal, where the moving lines diverge again in them and the blue line ends being above the other two moving lines indicating a bearish signal of the beginning of a trend. It is also important to say that the price just has to be below these 3 moving lines confirming the signal and thus we will be able to get the beginning of an uptrend.
So we can say that while the moving lines are close together, there is no trend in the market or the trend is weakening, but if the moving lines have a difference between them, it is because the asset is in an uptrend, which may be very strong. Remembering that the price in an uptrend must be above the moving lines, while the price in a downtrend must be below the moving lines.
Finally, comment that to know if the trend is weakening, we have to observe if the moving lines begin to have divergences by making crosses between them and with the price breaks in the moving lines in a bearish or bullish stage.
5.Explain how the Alligator indicator is also used to understand sell / buy signals, by analyzing its different movements.
Buy signal.
The signals that the crocodile indicator gives off are classified according to the formant pattern between its three lines that compose it.
Crocodile indicator criteria for a buy signal:
Green line above all lines.
Red Line is in the middle of the 3 lines.
Blue line below all lines.
To opt for a good point of purchase, it is necessary to observe in great detail when the Green line crosses the other lines from the bottom up, positioning itself according to the criteria described above, it is recommended that this green line cross at least ¾ periods to confirm the movement and the trend forms a certain movement.
Sell Signal
Crocodile indicator criteria for a sell signal:
Blue line above all lines.
Red Line is in the middle of the 3 lines.
Green line below all lines.
To opt for a good point of sale, it is necessary to observe in great detail when the Green line crosses the other lines from top to bottom, positioning itself according to the criteria described above, it is recommended that this Blue line cross at least ¾ periods to confirm the movement and the trend forms a certain movement.
Many traders execute their movements in the market, in two positions, either when the lines are meeting or when the bearish pattern described above has formed.
6.Do you see the effectiveness of using the Alligator indicator in scalping trading style? Explain this based on a clear example.
Scalping operations are exercised in short periods of time, whether between several seconds or minutes, all indicators are related through previous periods on the price, which causes that not all movements are predictable, but through the indicators we can Take advantage of the buy and sell signals and the crocodile indicator is optimal for this type of scalping operations, since it can be generated long and short operations through the visual patterns of its 3 characteristic lines that identify it, a very important thing is that if there is a defined trend, the indicator is more accurate, since in a consolidation stage it tends to give false signals.
A trader who applies scalping will be performing operations in very short periods, taking into account that they will be 1 minute candles and a maximum of 5 minutes in the market. These traders seek to have several operations in the day, taking advantage of the short movements that can be created in the market and where the trade usually ends very quickly.
Now using the Alligator Indicator, I think that if you could have a good strategy in a scalping trade, because the period of the 3 moving lines is short, then it can give us certain good signals that help to take a very profitable trade in a crypto asset.
7.Is it necessary to add another indicator in order for the indicator to work better as a filter and help get rid of unnecessary and false signals? Use a graph to support your answer.
As I said before, no indicator is 100% effective and it is highly recommended to use other indicators that help or accompany the indicator in order to avoid a false signal, a divergence or to be surer of the movement that the price is making is appropriate.
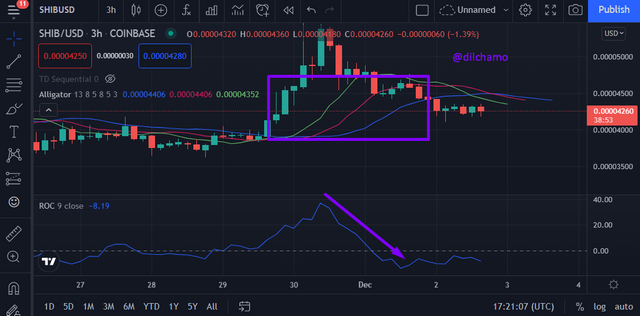
I will read the graph through the crocodile indicator in conjunction with the ROC indicator, remembering that the ROC indicator measures the price of the crypto active through percentage terms, this is useful since it gives us data in relation to overbought and oversold points in addition to its directionality, all this by reading its only line 0, it also allows us to visualize divergences that we can take advantage of.
We appreciate as the first point the start of the downtrend, where we visualize in the crocodile indicator the crossing of its 3 characteristic lines where the upper line is the blue, the middle is the red and the last is the green, this together with the narrowing of its lines that give us a very strong downtrend, in this cycle, we now visualize the ROC indicator, where the single line was located in the positive upper part above the 0 lines and crossed the 0 lines from top to bottom, which it throws a sell signal, then it positioned itself in the negative sector below the 0 lines, this shows us that the trend is bearish.
Then the crocodile indicator gave us a trend change signal from the start of the uptrend, where we visualized in the crocodile indicator the crossing of its 3 characteristic lines where the upper line is the green one, the middle one is the red one and The last one is the blue one, this together with the narrowing of its lines that give us a very strong upward trend, in this cycle we now visualize the ROC indicator, where the single line was located in the negative lower part at line 0, where a divergence occurred Bullish, at this point the ROC indicator line crossed the 0 lines from the bottom up, which gives us a buy signal, then it positioned itself in the positive sector above the 0 lines, this shows us that the trend is bullish.
8.List the advantages and disadvantages of the Alligator indicator
| Advantages | Disadvantages |
|---|---|
| It is very easy to understand and use. | While the setting of the moving averages is smaller, the indicator is more prone to throwing false signals, due to the fact that the moving averages move along with the price. |
| Provides trade entry and exit signals. | The use of other indicators is recommended to avoid a false signal or a divergence that could compromise our investment. |
| It can be used for various market operations, through strategies according to its own criteria. | Presents many false signals in consolidating or side markets. |
| Produces fewer false signals, since it is based on the reading of 3 moving averages, compared to others that only have 2 or 1 moving average. | |
| Its performance is excellent in the market with a clear trend. |
9.Conclusion
The Alligator indicator is an excellent tool to be used through technical analysis since it can yield excellent results through its 3 characteristic moving average lines that provide us with the directionality of the trend, its strength, and a consolidating market. This indicator was created by the behavior of the crocodile and when it sleeps, when it wakes up, and when it begins to eat, this movement was transferred to the market, since the market behaved in a similar way.
Thank you forfessor @ kouba01 for this amazing lesson. Thank you for reading my post.

Hello @dilchamo
Pls help get my post verified and also an upvote pls , it will soon expire
https://steemit.com/hive-172186/@negro-bby/achievement-4-applying-markdowns-by-negro-bby#comments
@dilchamo
Pls curate my achievement 4
https://steemit.com/hive-172186/@negro-bby/achievement-4-applying-markdowns-by-negro-bby#comments
Please help me 🙏and check this post
https://steemit.com/hive-172186/@mudaasar78/2bchqy-achievement-3-by-mudaasar78task-content-etiquette
Wow you really did a good job, more post from you dilchamo, stay safe always
Please review this task because five are going to upload it.
https://steemit.com/hive-108451/@ghiasahmad/blockchain-decentralization-block-explorer-steemit-crypto-academy-season-4-homework-post-for-task-4