Bitcoin (BTC) Price Update: Another Failed Breakout Attempt?
Hi guys!
Here are my thoughts on bitcoin for today.
BTC - Daily Chart
Tools used: Fib-Channel, Ichimoku Cloud, Stochastic RSI and Trendlines
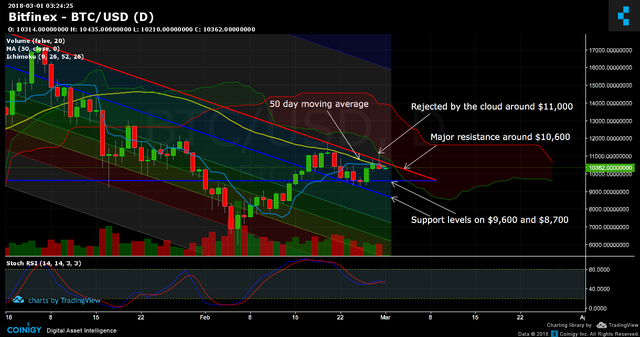
I've pointed out all current resistance and support levels on the chart. As I was expecting there are a lot of resistance around this price, you can get an idea of resistance and support from that ichimoku cloud. Also note that stoch RSI indicating a downtrend since the lines are crossing.
If you see people on social media saying that bitcoin has broken the current bull flag don't believe them. So far in the past 2 months there hasn't been a daily candle that closes above the trendline which means bitcoin is still on this current downtrend.
If you take a look at the volume, notice that instead of increasing it was decreasing which is not a volume that you would expect for a breakout to happen. It should 1,2,3 and 4 increase in volume on the daily chart. Here are 2 examples of a breakout with volume as a confirmation.
BTC - Daily Chart (Volume with relation to Breakout)
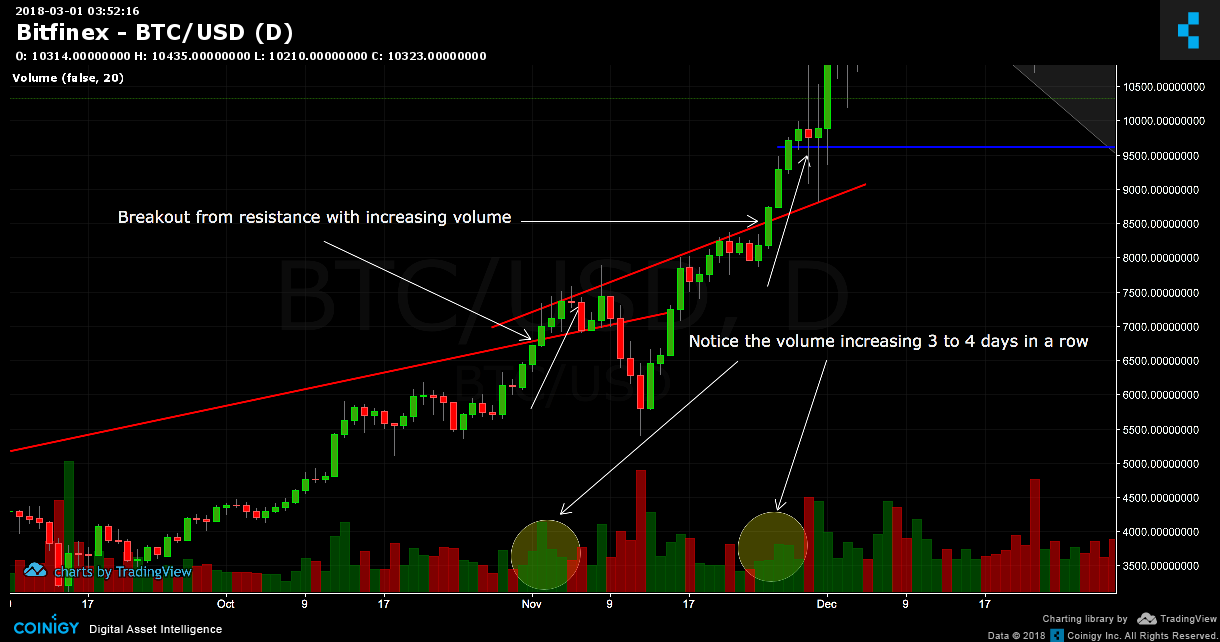
If you see volume with a pattern like this, then you can expect a more probable breakout. So, until I see a volume confirmation like this I don't think bitcoin is going to breakout from this current downward trend.
Disclaimer
You know the drill guys. This is just opinion and not a financial advise. Do you own research and decide your own trades. Cheers!