Are effects of nutrition and sports measurable and statistically relevant in short terms?
Anyone who follows my blog carefully will have found that I am trying to connect scientific facts and evidence-based (by self-study) observations to examine the issues of health and fitness.
[By the way: I have to apologize to my non-German speaking follower because I haven’t translated some of my articles until now. It is sometimes hard to realize this due to a lack of time. But hold the line! At least I will translate my articles concerning calorie restriction mimetics & telomeres within the next weeks.]
For more than three weeks, I do a so-called "90 days challenge" (In short “The Challenge” or “My Challenge”). You can find all details on this topic (also in English) here and in my (almost) daily posts.
Already before I began “My Challenge” I choose a lifestyle to program my body for an elevated level of autophagy. More about autophagy (also in English) you can find here, here here, here and especially here and here.
For several years, I have documented my entire life by writing diary entries and by collecting as many parameters as possible. The aim is to recognize possible health problems early enough and to counteract maldevelopment of my lifestyle.
Because of this reason, I use a smartwatch (vivoactive HR by Garmin) and a whole-body scale (KaradaScan BF511 by Omron).
These are certainly not the most accurate tools, but they help to gradually uncover peculiarities. Further, even though I'm certainly not a mathmagician, I'm very fascinated by numbers and data thus I just enjoy playing around with them.
In this article, I want to discuss some observations I made this week.
Often people come to me arguing in a way such as: "Sports has no real need!" Or "It doesn't matter what you eat or how much, the body will fix anything!".
The problems with statements like this are that many people don’t see a clear correlation between their lifestyle and potential health risks. In my opinion, this has to do with the fact that for instance, the intake of food with poor quality has no direct effect. Therefore, it’s hard to estimate what actually is harmful and what is not. The purpose of my blog is actually to show that the effects of a healthy diet and exercise, as well as the opposite of it, only show up after years.
But even on short terms, you can find a lot of hints whether you are on the “Path of Death” or not.
This week, I noticed something really exciting and that's what I want to describe in this article today.
I noticed that my resting pulse stabilized remarkably during “The Challenge”. In the following picture, you can see my pulse 27 days before and 27 days after the start of the Challenge.
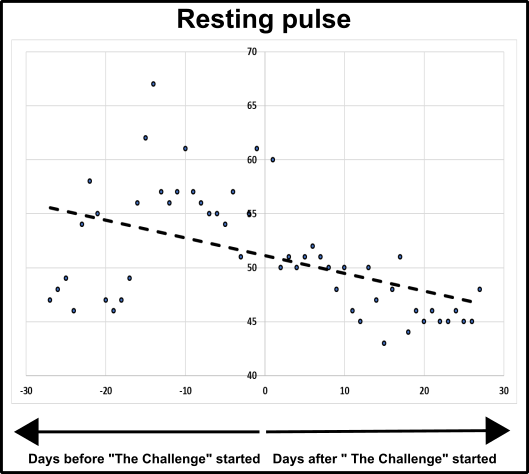
Fig. 1: Resting pulse (daily average) before and after the start of the challenge.
There is a clear trend towards a lower and more constant resting heart rate.
But to see if this is really the case, I made a statistical analysis of it as you can see in the following image.
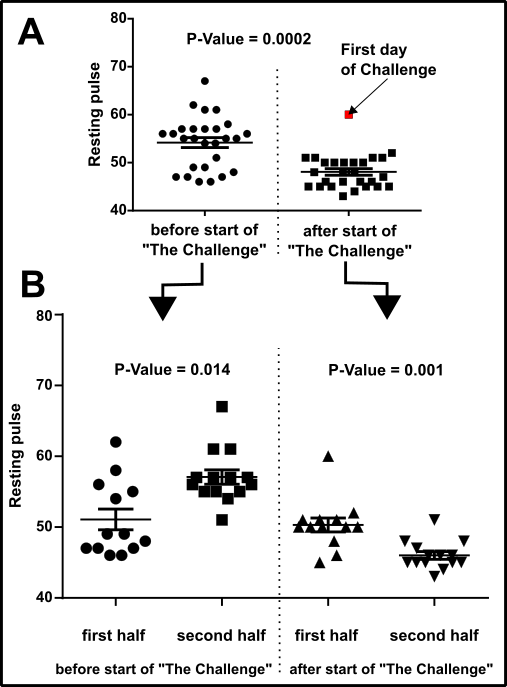
Fig.2 Statistical evaluation of my resting pulse. Shown is the mean ± standard error, as well as the results of the individual measurements. The statistical test was a paired Student's t-test (two-tailed). A. All values before and after the start of the challenge in comparison. The red measuring point shows the first day of the challenge. B. The record before and after the start of “The Challenge” was again divided into two subsets, the first and second half.
As you can see in the figure (Fig.2A) above there is a "statistical significance" in the difference of my resting heartbeat before and after the beginning of “The Challenge”. The ** P-value ** (which we will be discussed in more detail in the next article on CRM & Telomeres; also available in English in a few weeks, I promise) in this case simply states how useful it is to continue working with such a result. The smaller the P-value, the more "probable" (quotation marks were set consciously) it is that you are not completely wasting your time while continuing the test series.
However, it can already be estimated in Fig. 1 that we can observe very strong fluctuations particularly before “The Challenge”. This means that influences independently of “The Challenge” may have effects on us. Therefore, this raises the possibility that we could see such differences even in the absence of “The Challenge”.
To figure this out, I have now taken the sample size before and after the start of “The Challenge” and divided each into two halves. This should enable me to better recognize periodic effects. In Fig.2B the P-value indicates that the difference between the two halves before the start is in principle more "unlikely" than after the beginning of the challenge (the smaller the P-value, the better). However, in both cases, the P-values are very small. Because of this notion, you can argue that my results are caused by normal fluctuations.
For further clarification, the usage of the effect size could be the criterion of choice. To realize this, I calculated the so-called Cohens d with the help of this website here. The result was as followed:
Tab.1: Effect size / Cohens d.

As you can see, the effect size is very high in all cases (strong effect). Of course, it is much higher in the comparison of the heart rate before and after the start of “The Challenge”. However, the fact that in each case a strong effect can be observed implies that the observed effect may be coincidental or may at least not be as significant as indicated. Take again into consideration that also the above-mentioned P-value was very low in all cases.
Besides P value and effect size, there are still other criteria, e.g. the so-called Bayesian statistics. The latter means that other components such as previous knowledge, experience etc. should also be included in the assessment.
In my case, you could say, for example:
"Sport is good, healthy eating is good, avoiding alcohol is good, no smoking is good. Although I have already done everything in a comparable fashion than before ‘The Challenge’, I changed something of huge importance, so it is clear that fluctuations occur, but they rather show that the tendency is clear, because, under other circumstances, the effect size might be even stronger. Moreover, you can, in principle, see a big difference."
Please take into account that the Bayesian statistics is not as simple as described. This approach contains really complex mathematics as you can see here and here. But in principle, you can imagine the basic concept as I described it above.
I guess you can estimate that statistics are much more complex and involve much more factors, tests, etc. Furthermore, you “probably” (😉) can imagine that the rating is of course also very dynamic and manipulatable. Unilateral reliance on a test (e.g. P value only) may, therefore, lead to flawed studies more often than previously thought.
In order to support my data a bit more, I want to draw your attention to two further parameters.
Fig.3 shows the development of the amount of my body fat (Fig.3A) and my muscle mass (Fig.3B).
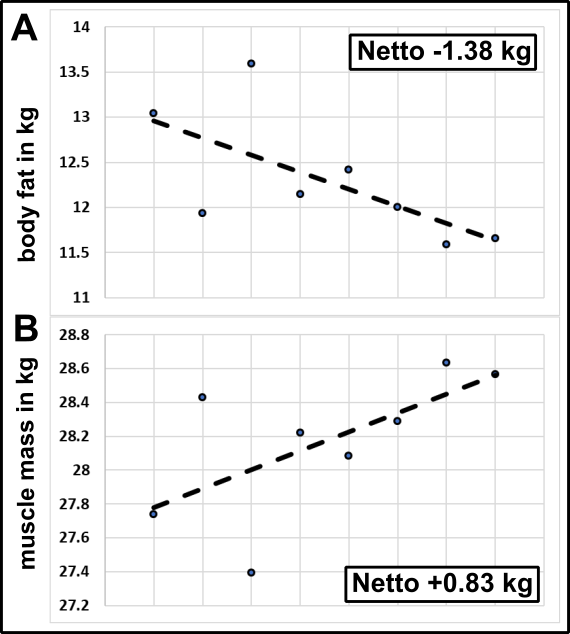
Fig.3: Body fat (A) and muscle mass (B) in kg. The measurements were carried out on various days, but sometimes not at the same time of day. However, starting and ending points were collected at the same time of the day under comparable conditions.
As you can see, in about three weeks I lost about 1.4 kg of fat and gained approximately 830 g of muscles. Of course, this would “probably” (😉) support the resting pulse results somewhat and thus prove that the effect is "real". But it has to keep in mind that the process of weighing was not carried out in an appropriately controlled manner, and therefore would not meet scientific criteria. Furthermore, it must be mentioned that my waist circumference remained essentially constant since the last measurement. However, since I am very thin and could have developed more abdominal muscles, this parameter has no particular relevance for me anymore.
We summarize
Because of the challenge, I was able to stabilize my resting pulse and reduce the overall heart rate. Although this effect is "statistically significant" (which can also be denied), the effect size is very high. The latter finding is definitely true but also in control tests. Intuitively (“pseudo-Bayes”), however, there is a clear effect. The comparisons of body fat and muscle mass within “The Challenge” provide further evidence for the authenticity of the effect. Additionally, it has to be taken into account that I have been living healthy and athletic for a longer time and therefore differences might not be as drastic as in untrained people. Another survey of the data is certainly useful. This allows me to pursue a supposed effect further, and possibly exclude possible fluctuations.
Perspective
I will post a similar article at the end of the challenge. Probably before Christmas. In the final article, I will prove if more data could display an effect or not.
What do the results mean for you?
Of course, an approach like this enables you to optimize your lifestyle, your diet, your training and more. With simple statistical analyses, you can assess whether the current program has any contribution to you. Further, you can adjust your strategy to find the best way.
All that you need is excel or calc (here the free German link!) to collect your data, to visualize them and eventually to run your own Student t-tests.
That's it!
To answer the question from the headline
Yes, the effects of your diet and exercise program are measurable in short terms and may show some "statistical significances" (at least in my case). To what extent this display the reality must be assessed after observations over a longer period. Tests at the beginning give you the opportunity to see if you are on the (possibly) "right" path.
Limitations of this "study"
- I am not a statistician and have made this article while having "breakfast" (if you want).
- The measuring instruments I used were no validated scientific devices. Further, the measurement intervals of fat and muscle also fluctuated and had been collected at different times (note: measurement of start and end values were made at the same time of the day).
- There was no control by other persons. The "study" is therefore colored by subjectivity.
- Furthermore, if I would try to publish this in a scientific journal much more data from various persons and controls must be measured. Moreover, more statistical skills are needed to find the best and most reliable result.
In the final article about telomeres & CR(M) I will talk a bit more about stuff like this. Unfortunately, all non-German speaking Steemians have to be patient until I a) have to finish the last article of the series and b) have to translate all the remaining articles into English. But no trouble I will try to finish this in the next few weeks. Just follow @chappertron and stay up to date.
Have a nice start in the week.
Regards by Chapper
References
I have collected some statistic knowledge within the years from various sources. More recently I came across the German version of Scientific American called “Spektrum der Wissenschaft”. “Spektrum der Wissenschaft” sometimes has special releases such as a publication about statistics this year which is called “STATISTIK – Zahlenspiele mit Mehrwert” (Spektrum der Wissenschaft KOMPAKT 2.18).
Nevertheless, for further English reading the following articles might be helpful:
- Ioannidis, J.P., Why most published research findings are false. PLoS Med, 2005. 2(8): p. e124.
- Depaoli, S., et al., An introduction to Bayesian statistics in health psychology. Health Psychol Rev, 2017. 11(3): p. 248-264.
- Cohen, J. (1988). Statistical power analysis for the behavioral sciences (2nd ed). Hillsdale, N.J: L. Erlbaum Associates.

Shouldn't this be @steemstem rather than @utopian-io ? :P
I also uploaded a german version which has steemstem as first tag
Grüße nach Österreich ;-)
Yeah, but you still got things mixed up :P
If you wonder why @utopian-io is upvoting your STEM-stuff - they cooperate with @steemstem / @de-stem - But you should only use the STEM-related tags ;)
A little bit complicated, I know^^ But know you know for the future!
Have a nice Sunday!
Oh man I'm a complete tagging idiot!
Thanks for the reminder.
I thought @utopian-io is also a science community because they upvoted my science stuff occasionally.
Maybe it's a better idea to remove their tag. I don't want to spam in that way!
Jetzt sollt's passen
Grüße
Oh, removal not possible
hhhhmmmm
Ich darf auch darauf hinweisen, dass steemstem ein und denselben Autor nur 1x in 24 Stunden voted... Warum meine Übersetzungen immer 1-2 Tage verzögert kommen, darf man sich jetzt dazu denken...;-)
Alles klar!
Ist aber kein Problem für mich erstmal!
Grüße
No need to be too harsh to yourself, it’s an understandable missunderstanding that the guys curating the Utopian category will survive ;)
You can’t change a post’s first tag^^
At least you are smarter now :)
Definitely ... ;-)
If you say this. I have no idea.
I think I will change the tagging a bit.
Thanks
My shotgun is more linear :D
I hope so!
;-)
I'm kidding a little bit. Results in biology/medicine are often like yours. The post is great
Thanks,
I really appreciate the feedback.
Regards
Congratulations! Your post has been selected as a daily Steemit truffle! It is listed on rank 9 of all contributions awarded today. You can find the TOP DAILY TRUFFLE PICKS HERE.
I upvoted your contribution because to my mind your post is at least 10 SBD worth and should receive 113 votes. It's now up to the lovely Steemit community to make this come true.
I am
TrufflePig, an Artificial Intelligence Bot that helps minnows and content curators using Machine Learning. If you are curious how I select content, you can find an explanation here!Have a nice day and sincerely yours,

TrufflePig