Steemit Crypto Academy Season 4 Beginners' course - Homework Post for Task 10 : Candlestick Patterns] | by @chairulrizalx

1a) Explain the Japanese candlestick chart? (Original screenshot required). 1b) In your own words, explain why the Japanese Candlestick chart is the most used in the financial market. 1c) Describe a bullish and a bearish candle. Also, explain its anatomy. (Original screenshot required)
Hello Everyone
Season 4 of Steemit Crypto Academy has arrived at Week 6, and on this occasion, I will complete an assignment for Beginners Level Introductory Fixed Course at the Crypto Academy. In this post, I will complete Task 10 which is discussed Candlestick Patterns - Steemit Crypto Academy Season 4 Beginners' course - Task 10: Candlestick Patterns mentored by Professor @reminiscence01.

(1a). Explain the Japanese candlestick chart ? (Original screenshot required).
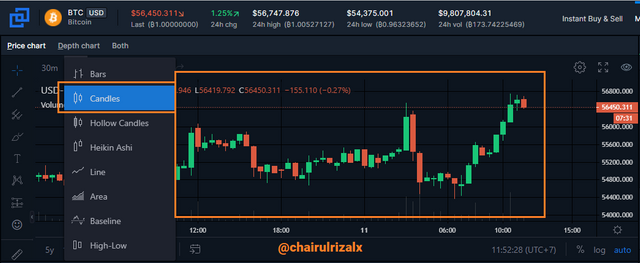 Screenshot From Bittrex Exchange source
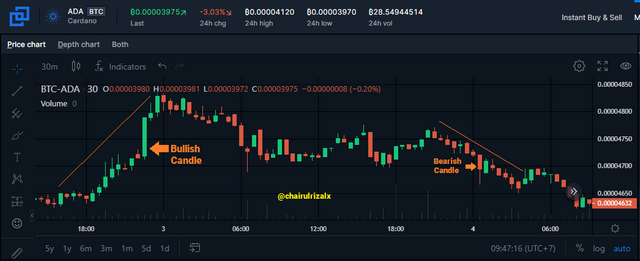 My Screenshot From Bittrex Exchange source
(2a). In your own words, explain why the Japanese Candlestick chart is the most used in the financial market.
This Japanese candlestick was originally only used by Munehisa Homma to analyze the rice sales market, which at that time there was no modern analysis like today's traders do. And at this time Japanese candlesticks are widely used by stock and digital asset traders. The reason why most traders choose to use Japanese Candlesticks in the financial market is that the price action on the candlestick is basic to be used as an indicator in predicting price changes which are considered effective enough to provide signals that will occur during trading.
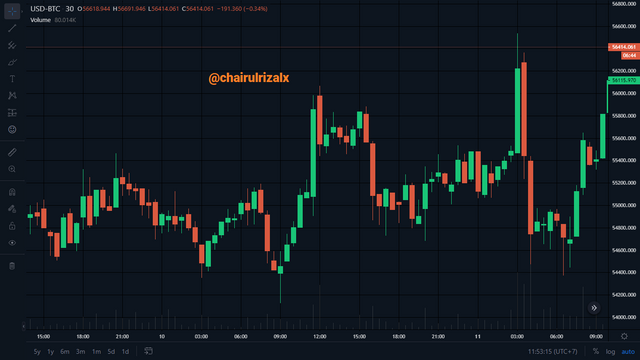 Screenshot From Bittrex Exchange source
(3a). Describe a bullish and a bearish candle. Also, explain its anatomy. (Original screenshot required)
 Screenshot From Poloniex Exchange source
Bullish
Bullish means that the market conditions for stocks and digital assets are good and asset prices will increase, besides that the term bullish is used to predict prices that will rise based on uptrend market conditions. Demand and supply also influence market situations which will later determine whether there will be Bullish or not, bullish is a positive thing that is awaited - later by traders who expect a profit.
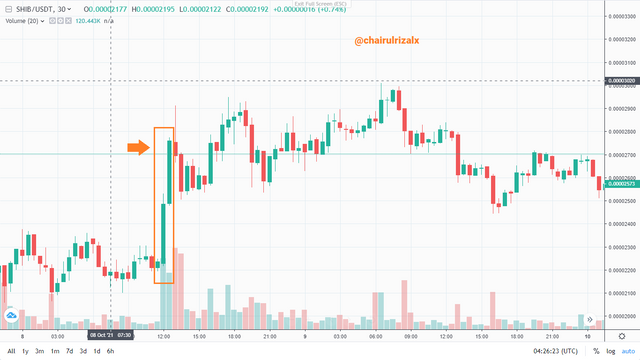
The image below is an example of a bullish signal that gives the market a green signal.
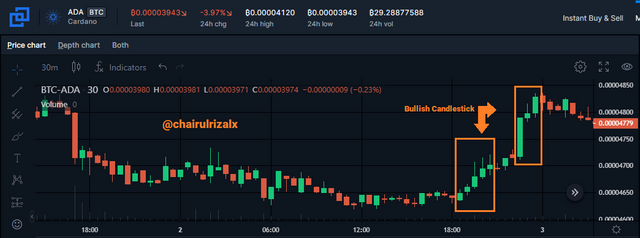 My Screenshot From Bittrex Exchange source
 The image I designed using Microsoft Paint.
(open)
As an indicator of the initial price or purchase of an asset within a certain period.
(closed)
As an indicator of the final price or purchase of assets within a certain period.
(high)
The highest price of an asset in a certain time.
(low)
The minimum or lowest price of an asset within a certain period of time.
Bearish
Bearish terms in stocks and digital assets are market conditions that are declining or weakening caused by the price of digital assets or stocks falling overall. This bearish condition is used by investors to predict a stock price will move down and prepare an analysis to avoid losing, this bearish signal gives a red color as a sign that the market is in a downtrend.
 Screenshot From Poloniex Exchange source
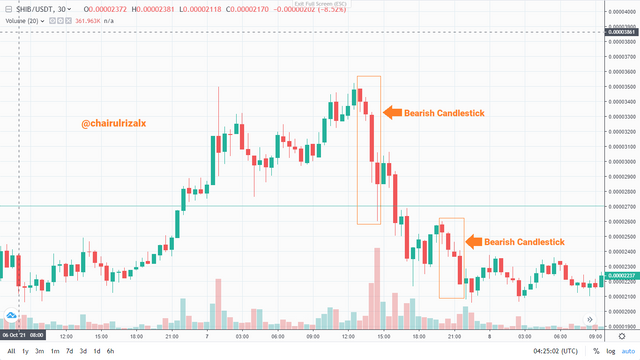
The image below is an example of a bearish signal that gives the market a red signal.
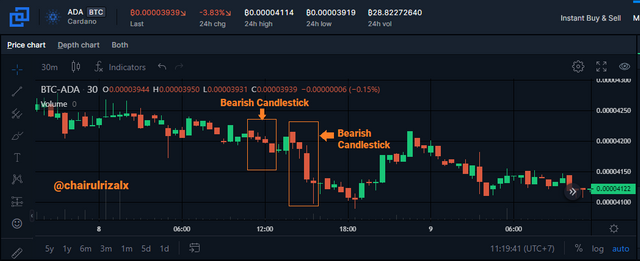 My Screenshot From Bittrex Exchange source
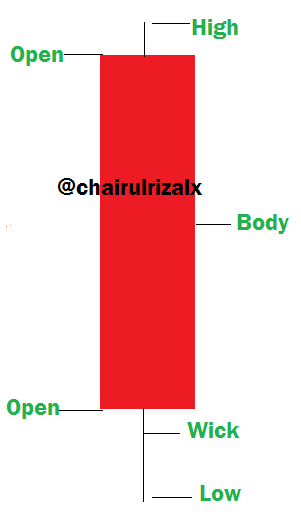 The image I designed using Microsoft Paint.
(open)
As an indicator of the initial price or purchase of an asset within a certain time.
(closed)
As an indicator of the final price or purchase of assets within a certain time.
(high)
The highest price of an asset in a certain period.
(low)
The minimum or lowest price of an asset within a certain period.
Conclusion
In this assignment, I learned a lot about the Japanese Candlestick for traders, especially for beginners. After understanding Japanese candlesticks and charts, it can be concluded that it is important to learn chart recognition for beginners in the trading world because it will be difficult if we do not have basic knowledge of these charts. This lesson also trains how to learn to analyze a piece of information or data obtained so that it can be developed again.

Thank You
cc Professor : @reminiscence01 @dilchamo @nane15
cc Professor : @reminiscence01 @dilchamo @nane15