September Stockmarket Woes
I might be wasting my time writing this, as a month is a lot of time for anything to happen in our current economic climate. While I have a good track record of being wrong with my predictions, I have a great track record of spotting strange events before they occur, and I think September is shaping up to be the month from hell for investment managers.
Some noteworthy factors:
Farmers in the USA and elsewhere are experiencing weather and climate obstacles, especially flooding, and by mid-September I predict the USDA will not be able to contain the problem in the USA. Same goes for other nations that are experiencing poor growing conditions and a potential loss of crops.
Negative yielding Bills, Notes and Bonds. Even bonds in the USA are negative yielding when you account for inflation of the money supply. This doesn't account for a much greater loss in purchasing power of currencies, shrinking much faster than the money supply is inflating.
End of seasonal income. A lot of businesses in the west rely on seasonal income. Once we move into September, a lot of that income potential is gone.
Shrinking Retail revenue. With Online retailers only taking 5-10% of retail revenue, and big box stores soaking up the rest of retail revenue, no one can make the excuse (yet) that online shopping is killing malls and box stores. To be fair, online shopping is generally cheaper, so you could say that online shopping has more than 10% of net revenue because of better margins, but that still doesn't impact box stores directly.
Trade wars. While its mostly going to hurt the USA and China, the slow down is still going to hurt hard in September when more Tariffs are piled onto Chinese imports (except for Apple and other preferred businesses, which is unconstitutional btw). Since 2008, all the large corporations have been squirreling cash away, and now the 3 biggest corporations in the USA are hoarding in excess of $4Trillion dollars domestically or off shore. While you could chalk it up to greed, in this case I believe the hoarding of cash is a reaction to the threat of 2008 being just a warm up, and the real turmoil is still ahead of us.
Workplace participation has been shrinking since 1999, with fewer and fewer people joining the work force once they are an adult, or perhaps there are fewer people working above the table. Either way, the velocity of currencies around the globe has been slowing since the turn of the century as well, which may partly have to do with offshore activity, but more than likely has to do with a drying up of liquidity. Cash is one form of liquidity, and it is being hoarded. Additionally, there is very little real capital out in the wild, with most capital coming from secure and unsecured credit.
Lastly, the Major Indices of the Stock Market are becoming deliberately erratic, with a tweet here and a rumor there giving day traders a constant boner as profits keep pouring in.
There are many other indicators as well, but I figure it can't hurt to write a few of them down. It would take a lot of writing to cover topics like Bank insolvency, General Electric showing signs of insolvency while on rampant damage control in the media, real estate tightening up, governments cutting tax breaks left, right and center.
The Dow Jones Index is looking rather interesting though, and that's where all the data starts to flash warning signs around September 19th or September 20th 2019, which I believe will be an inflection point for the global economy, and that's where/when I'm going to be watching. Something weird could happen before then, but there seems to be a lot of market squeezes converging in the month of September, and charts for market indices will likely reflect this.
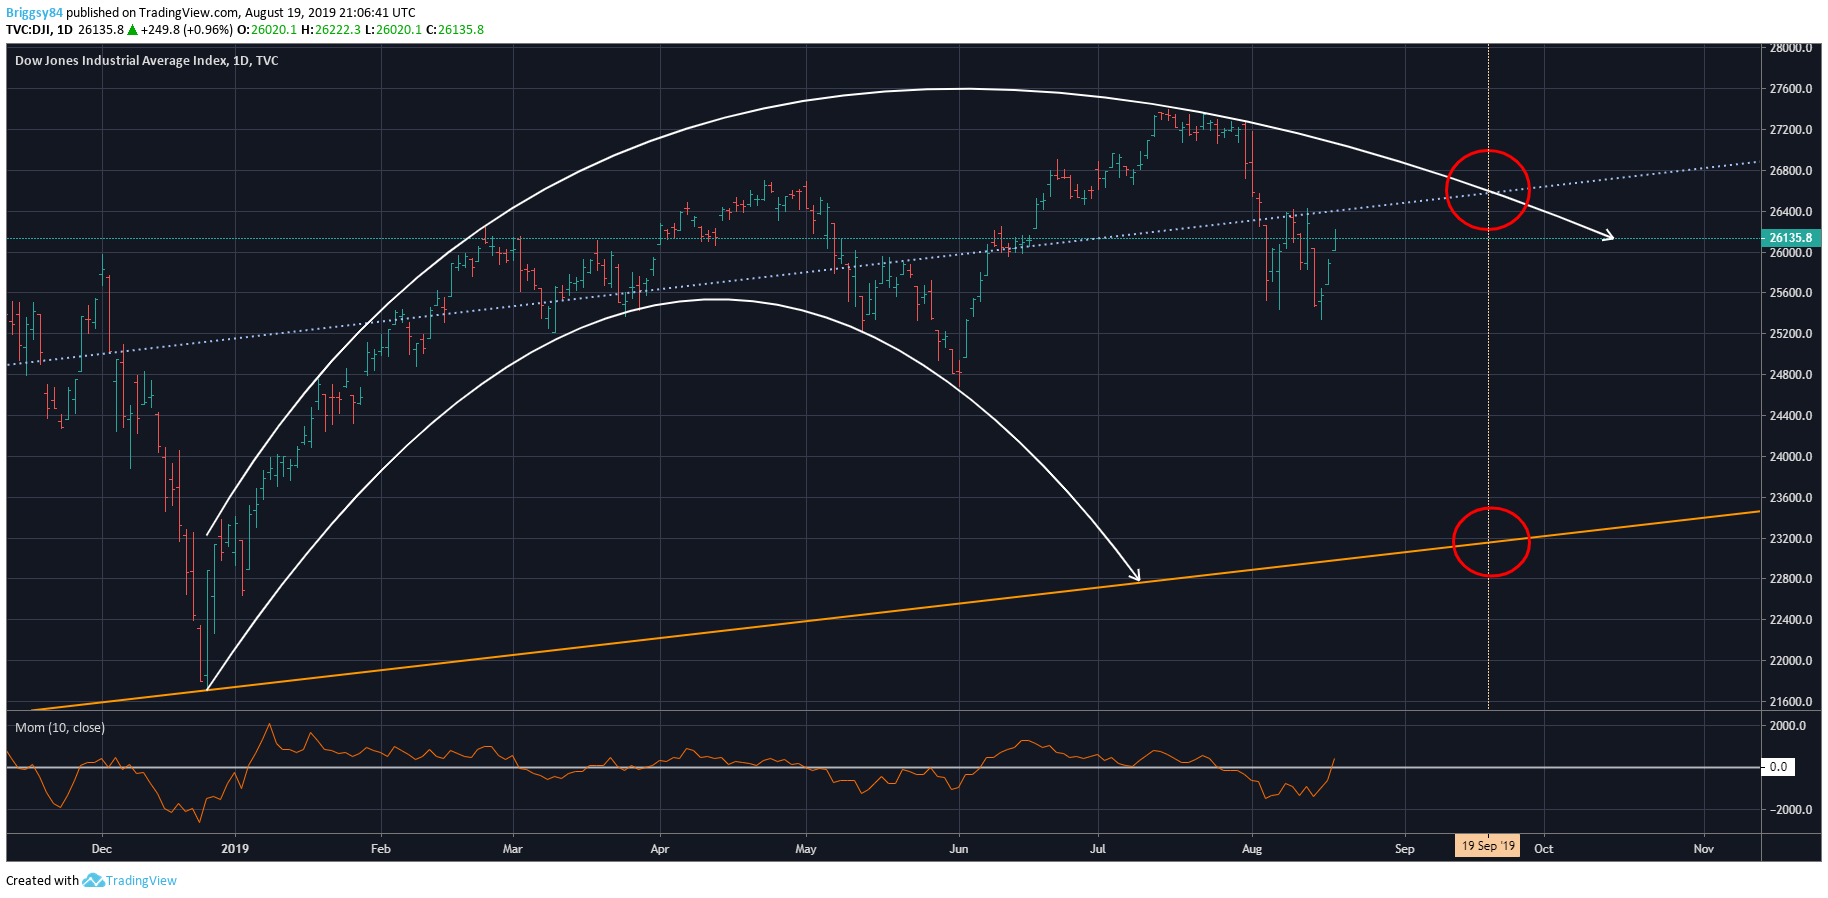
The chart above is the daily chart of the Dow Jones Industrial Average, but I could probably use the S&P 500 and get similar data. The solid orange line is the long trend line that has held since the last recession, and if price breaks below and confirms, then I would expect panic. The dotted horizontal sloped line is the half-way point between the floor and ceiling.
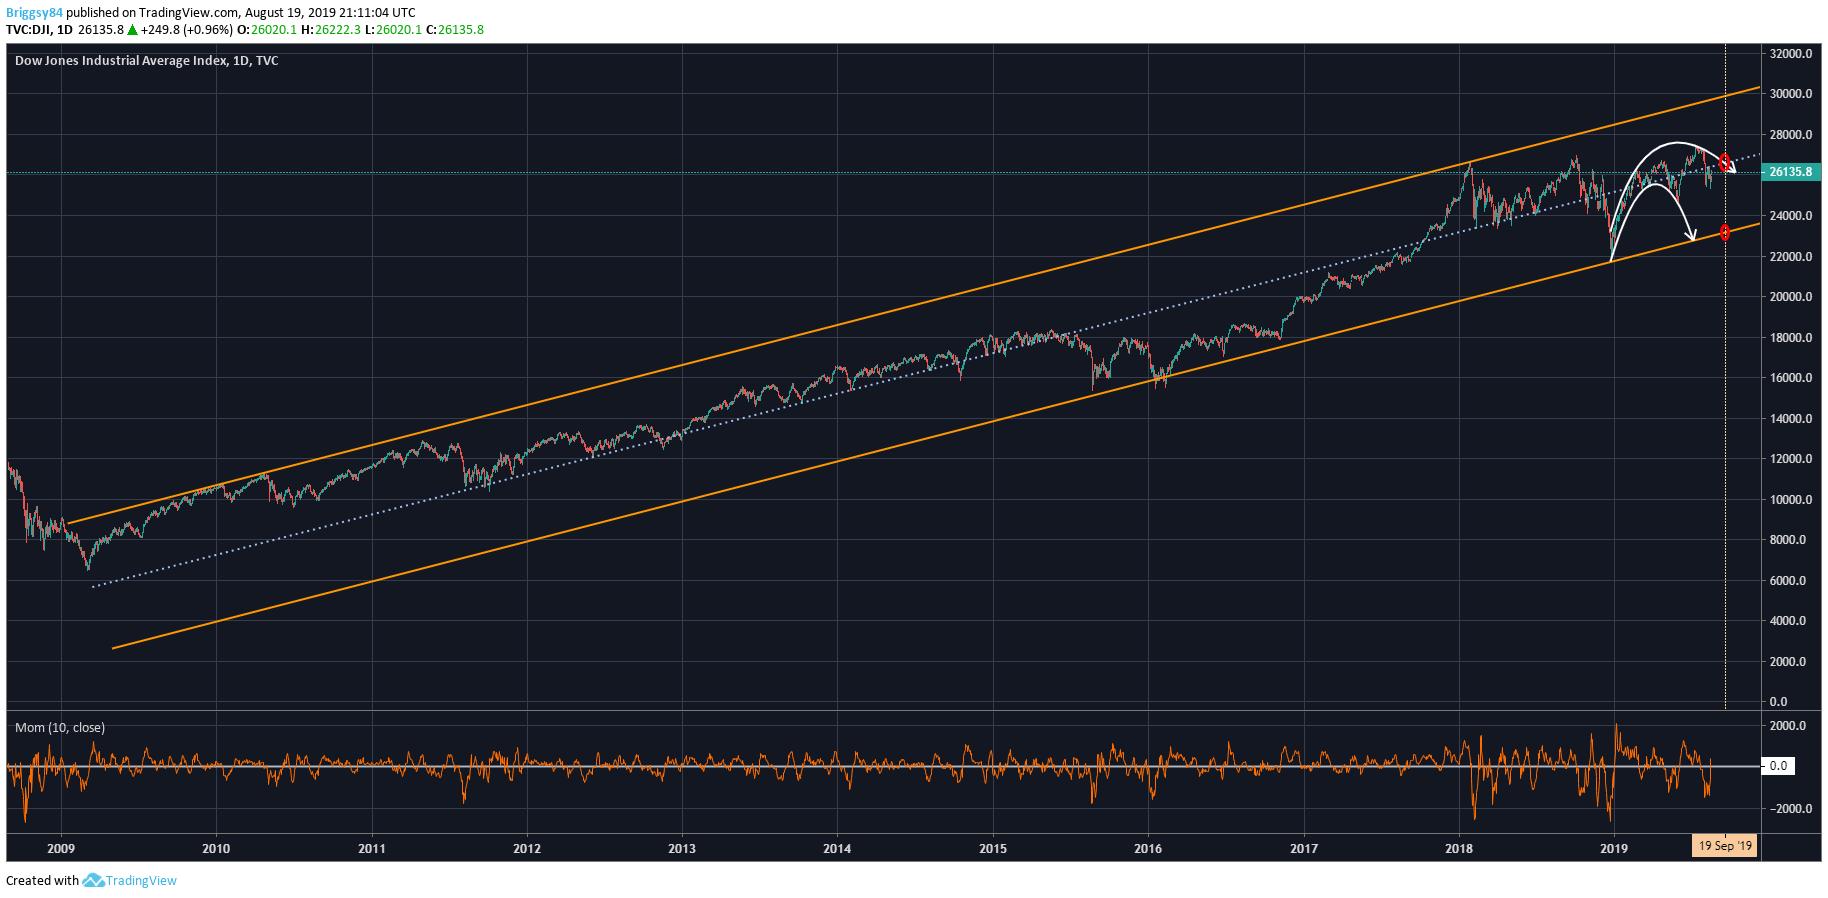
This next chart is zoomed out to show the Dow index since 2009. The price has held tight in this channel for 10 years now, but i get the feeling the price will break through the floor before the year is up, and in my mind mid-September has all the makings of the perfect storm to hit economies around the world.
Thank you for reading. Shares and comments are always welcome. If you disagree with my opinions, don't be afraid to voice them, we're all human and prone to bias and bad judgement. Just keep safe and prepared now so that you don't have to worry later.
Hey mate. Nice work, I’ve given you a follow.
It’s still hard to find quality markets and trading content here. I still find there is no consistency in the tags and I hope that tribes can go a way to solving this.
Anyway, keep the quality high and I’ll see you around 😎.
Posted using Partiko iOS
To listen to the audio version of this article click on the play image.

Brought to you by @tts. If you find it useful please consider upvoting this reply.