CTS 1: Effective Trading Strategy using Line Charts
I've been deliberating on this line chart strategy in trading. This is the continuation as I talked more in identifying resistance and support level and how this line chart prove to be effective and efficient. Can we successfully trade on profits using line charts and how can we use this chart in identifying market trends? This would be discussed in this post.
Link to previous class
Relationship between line charts and candlesticks |
|---|
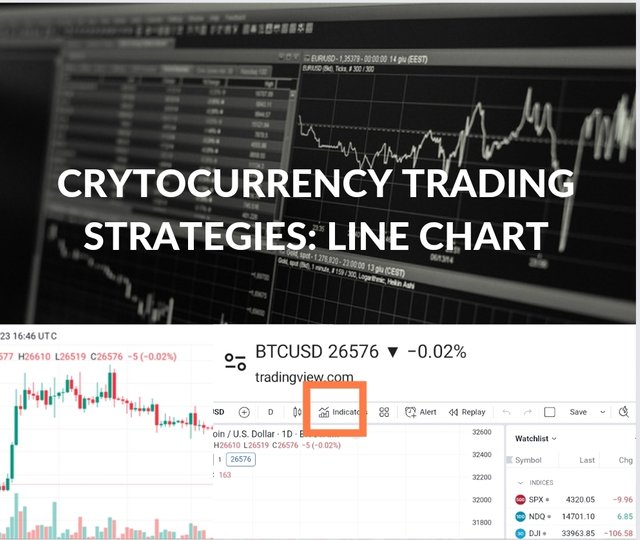
Like I said, many prefer using Japanese candlesticks on the candlesticks chart to trade but line graphs can prove effective as it only connect prices of an asset. This trading strategy filters out noise in the market which can also be seen in candlesticks charts. A trader does not need to see all the details or information as the chart is ideal for higher time-frame analysis on market flow and overall trend structure.
This line graph provides a clear picture of market trends and price movements without any noise compared to candlesticks charts. Where candlesticks can be applicable is when making trading decisions on location and stop-loss distance. The information of candlestick chart may be important to estimate the level of volatility and also place trades. So both strategies are useful to traders.
Suitable indicator that we can use with line charts |
|---|
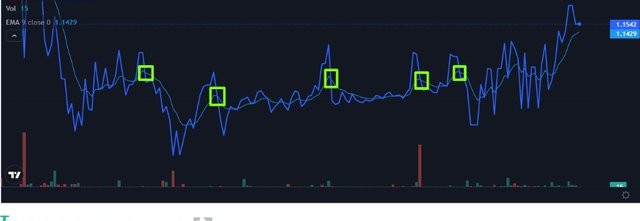
Moving averages are used with line charts to confirm the movement in price of an assets. Moving averages provides support during bullish and provide resistance in bearish trends. The higher the moving average, the stronger the support or resistance price meet. This is a general rule that affect the market. The bigger the time-frame too, the stronger the support and resistance.
These moving averages as an indicator reveals the trend's strength. The more the price comes to the moving average, the weaker the trends reveals which eventually breaks. The less the price comes to the moving average, the reverse. Using line charts in this case can be useful especially when the line chart touches the moving average as shown below. A trader can be consider a relevant test when such happens.
How to find or identify bullish and bearish trading opportunities? |
|---|
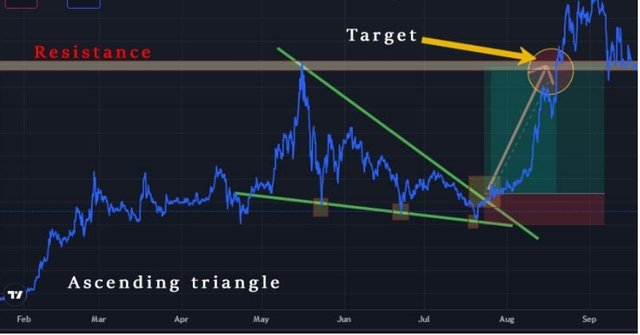
Identifying these trading opportunities accurate is very important in trading crypto assets. The loss and profits of a trader depends on the accurate identification of these trends. Thes trends can be identified using ascending and descending triangles as shown below. This is how it works. To identify the bullish trend, let's use the ADA/USDT as a crypto pair.
From the charts, I demonstrated the descending triangle which highlights few higher lows. The triangle is downwards which gives rise to the bullish trend signal going up. After identifying the triangle, there can be a rise in the asset as shown where the market target is. To identify the bearish signal, it is the reverse as the descending triangle would be used.
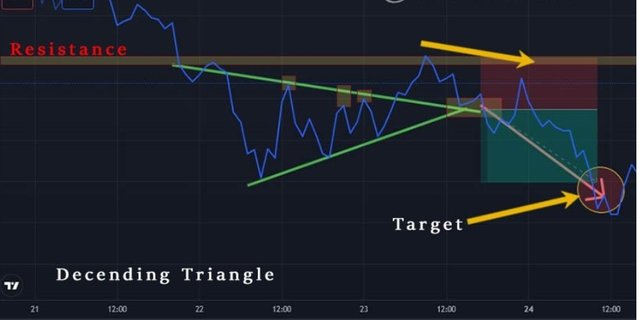
Unlike the bullish that there are few higher lows, they are continuous low highs which declines with time. After identifying the triangle as shown, there's a huge downfall of the asset price. There are other methods where traders can identify price trends of crypto assets. This is one.
Advanced and Disadvantages |
|---|
Line chart strategy are used and best for beginners as it is simple a d easy to understand basic chart reading methods before advancing to complex techniques of trading using candlestick patterns. Although it can be advantageous but has disadvantages. The following are its advantages and disadvantages...
Advantages:
Line charts show changes and trends over different time intervals.
It shows small changes that are difficult to depict in other charts
They are simple, easy to understand and best for presentation of data.
Disadvantages:
Plotting too many lines makes it difficult to read.
Wide ranges of data cannot be traced using line chart
Conclusion |
|---|
The line chart is a simple and easy to understand chart pattern used to most beginner traders to identify price trends of an asset. This line chart only indicate the closing price of an asset. The bullish and bearish opportunities can be identified biding different techniques I'm the line chart of which one is descending and ascending triangles. To confirm a price tend, the line charts can be monitored by adding an indicator called moving average vor by monitoring when the moving average touches the line chart. We'll be looking at another trading strategy next post.
Disclaimer:Any financial and crypto market information provided in this post was written for informational purposes only and does not constitute 100% investment advice. It's just basic knowledge every crypto trader or investor should have.


https://twitter.com/bossj23Mod/status/1705974715620196701?t=9vYph2Bx7FuxaOg6wWRUxA&s=19
Dear @bossj23 ,
We appreciate your active participation and contributions to our community. To ensure a positive environment for all members, we have implemented a set of guidelines to maintain respectful and constructive discussions while upholding community guidelines.
The use of line chart in trading the cryptomarket is very effective.
One reason I like making use of line trading is that it filters the noise from the market
Now Engage, Connect, and Inspire Each Other to Reach New heights.
Thank You.