Double Top and Wedge Trading - Crypto Academy S6W2 - Homework Post for @imagen
Hello everyone, How are you all doing?, I welcome you all to the second week of season 6 of the crypto academy. This week as well, we will be focusing our studies on Crypto trading where I get to explain to you how to trade using Double Top and Wedges.
On today's, I will be submitting my task to professor @imagen, after I have studied and understood the Topic "Double Top and Wedge Trading", where I will explain how to identify trends with this strategy, also give more insights to identifying the supports and resistance level, and how we can also execute a safe trade using this strategy, You can as well join me to study the course from the Page. WISH YOU A HAPPY READING!!!

When reading a market or at the entrance of making a trade, understanding the market psychology, as well as the market structure, might help traders get an early hand in the market. The Double top and Double bottom help traders to analyze and predict the market movement, the Double top form the "M" structure in the market movement, and as well the Double bottom form the "W" structure, which at the end of the market structure "M" or "W" a reversal is expected to occur.
Double Top: - Double top is a reversal structure that is framed after there is a slight move up in the market causing the value to get to its peak or we can also refer it to like the tops that the market shaped when the value hits a specific level that can't be broken. In the wake of hitting this level, the price will reach the highest level and somewhat however at that point get once again to peak level once more framing the market to form the "M" structure.
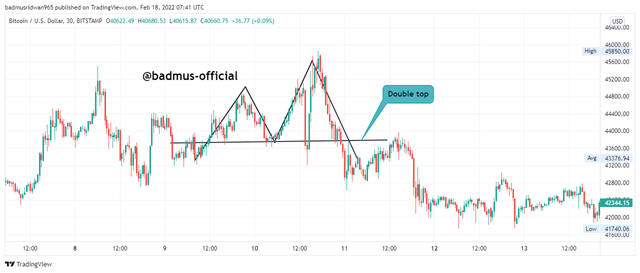
From the chart above you can see two peaks that were shaped after a solid move up in the market of BTCUSDT. we could as well notice how the subsequent top of the trade couldn't break to the high of the two top.
With this, we could confirm that this is a solid sign that an inversion will happen because it is letting us know that the purchasing pressure is just about wrapped up whereby, we get to see more sellers in the market causing the market to move in the other direction.
After noticing the double top, we would submit our sell order at the neck area since we are expecting a bearish market next. Checking out the chart you can see that the value breaks the neck area and takes a bearish trend.
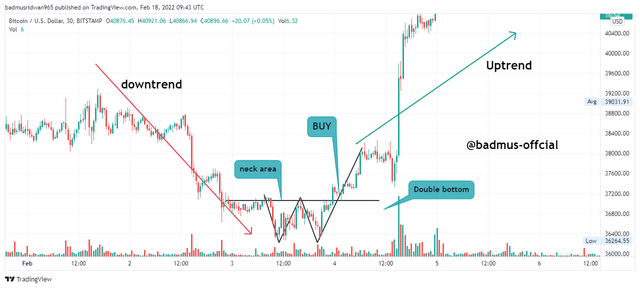
Double bottom - A Double bottom is also a trend reversal structure that is framed after there is a move down in the market causing the value to get to its low peak or we can also refer it to as the bottoms that the market shaped when the value hits a specific lowest level. In the wake of hitting this level, the price will reach the lowest level and somewhat however at that point, the price gets low again to peak level once more framing the market to form the "W" structure.
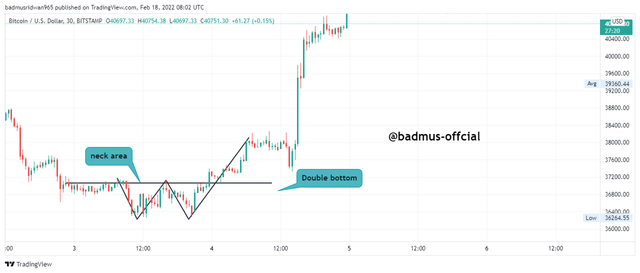
Just as we could see from the chart above, is the two peaks that were shaped after a solid move down in the market of BTCUSDT. we could as well notice how the subsequent low of the trade couldn't break to the lowest of the two low.
With this, we could confirm that this is a solid sign that a reversal trend will happen because it is letting us know that the selling pressure is just about wrapped up whereby, we get to see more buyers in the market causing the market to move up in the other direction.
After noticing the double bottom, we would submit our buy order at the neck area since we are expecting a bullish market next. Checking out the chart you can see that the value breaks the neck area and takes an upward trend.
Wedges can be used to view an important early warning indication of a value inversion or continuation in the market. In a Wedges, a market is said to consolidate causing it to frame different highs and lows before eventually picking a new direction or as well might give continuity to the previous trend.
When a trend forms a wedge, It implies that the greatness of value development inside the Wedge is diminishing, and at the same time, wedges signal a delay in the current market which thus signals that a new market is yet to surface.
We have two types of wedges, which are the Falling and Rising wedge;
- A Falling Wedge is a bullish pattern that frames in a market pattern, and afterward, the lines incline down.
while
- A Rising Wedge is a bearish pattern frame that is found in a descending pattern, and the lines slant up.
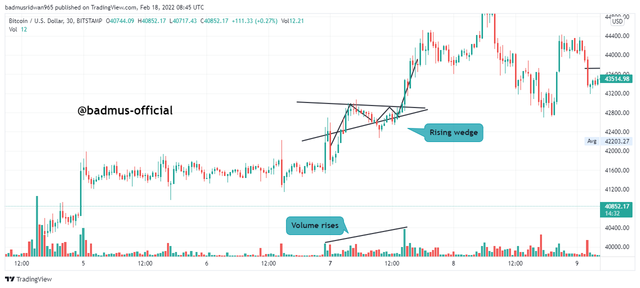
Rising Wedge - A Rising wedge can be easily recognized when the market solidifies between two or more Highs and Lows lines. To shape a rising wedge, the support and resistance lines will both need to point in an upwards heading and the support line as well must be more extreme than resistance framing. when this is been identified in a pattern, the wedges are considered a rising wedge, we can as well see the correlation of it from the market volume, the rising wedge mostly implies a bearish reversal next or the bullish trend continues.

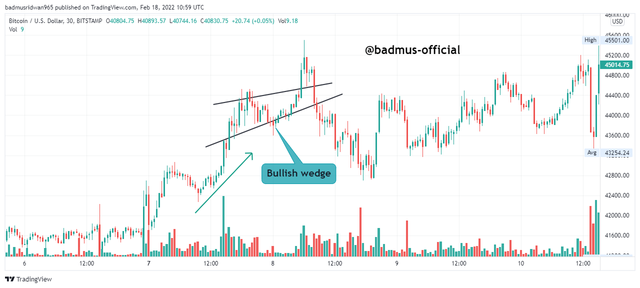
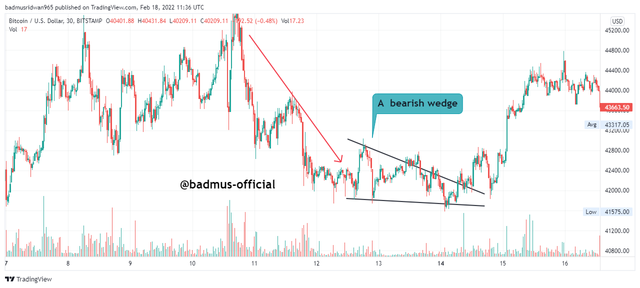
Falling Wedges - A falling wedge can be recognized when the market solidifies between two or more Lows and highs. To shape a falling wedge, the support and resistance lines will both need to point in a downward direction and the resistance line as well must be more extreme than the support framing. when this is been identified in a pattern, the wedges are considered a falling wedge, we can as well see the correlation of it from the market volume, the falling wedge mostly implies a bullish reversal next

Just as explained earlier, these structures can be identified in the market to give traders early info of what the market might do next, traders take the advantage of this to boost the level of their trade to their advantage.
Structural difference - The Structural difference with the Double top and bottom is that the Double top meets at the top forming an "M" structure whereas, the Double bottoms meet two lows in the bottom forming a "W" structure.
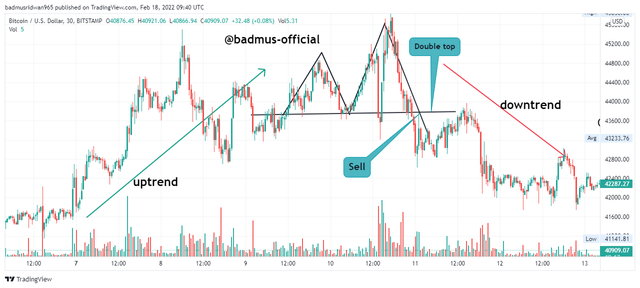
Trend Difference - the trend difference between the two is that the Double top is mostly found in a bullish trend whereby, the trend gives an early insight of a reversal next as the point we witness the neckline breaks, reversal is non-negligible, the double bottom is found in a bearish trend, after, which a bullish trend is expected to occur after the market breaks the neckline.
Trades - We execute a sell trade after discovering the M structure as that's the early figure of bearish, while, we execute a buy trade at the neckline of the double bottom.
An Image showing the differences
The two images below show the structural difference and as well the trade execution differences between the Double top and Double bottom.
Bullish Wedge:
A bullish wedge is the wedge structured when the market is currently bullish, as we could witness two or more support and resistance level in the structures, in this case, the market all of a sudden consolidate in the bullish trend, what is expected next of this is a reversal or it might as well be a continuation of the former trend.
Bearish Wedge:
A bearish wedge is the wedge structured when the market is currently in a bearish trend, as we could witness two or more support and resistance level in the structure, in this case, the market all of a sudden consolidate in the bearish trend, which is expected next of this is a reversal as the market climbs to bullish next.
Volatility simply refers to the level of fluctuation in the market, as we know the volume works concerning the number of purchases and sales in the market.
Here, I will show the difference in the volume of the market at the moment we witness the wedges.
In Rising wedge - The market tends to increase from the previous, the Buyers trades were higher, for instance, in the chart below, we could see that the market breaks high a little in the rise of the volume, with this, we could point to the level of buyers in the market.
In Falling Wedge - When the Falling wedge is discovered, we tend to see drops in the market volume, in this case, we get to see that the purchasing power has reduced, which thus causes the volume to reduce.
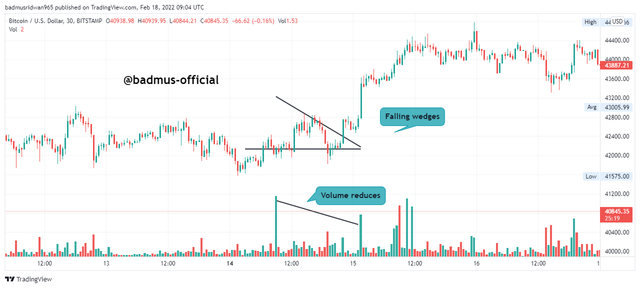
at the end of the wedge concerning the volume, we could see a high rise in the volume level causing us to see a new trend in the market as the volume moves up.
I will be analyzing the market of ETHUSDT and LUNAUSDT to illustrate and analyze the double top market structure and how to carry out trade with it.
Chart of ETHUSDT: - From the chart below, I was able to identify the M market structure as the market breaks two highs of nearly the same level, which afterward, a bearish trend is identified, I then placed a market to sell when the market breaks below the neckline, my risk/reward level at 2:1.
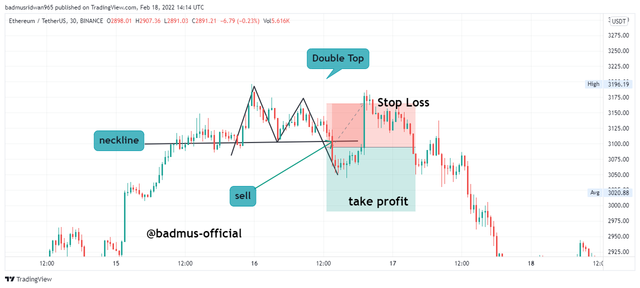
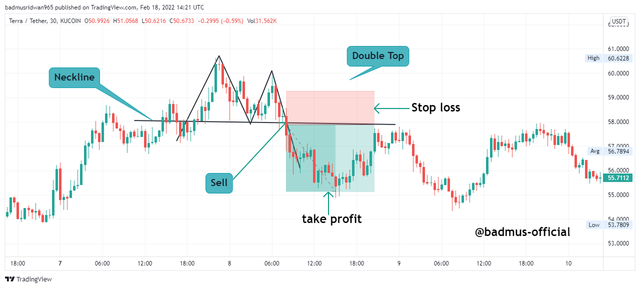
Chart Of LUNAUSDT - The same was seen from the LUNAUSDT chart, the market forms the M structure when it was in uptrend position, afterward, the market breaks to the lowest, the best position for the entry was below the neck area, placing a sell order in that position will let trader catch the phase of the market early, and make a profit and as well take advantage of the trend.
For this task, I will be analyzing two different charts of the falling and rising edges of the market ETHUSDT and as well as the LUNAUSDT.
Rising Wedge -The rising wedge is mostly identified in the upward market where the trend is considered to be done when we witness the phase of the market to be ranging, especially in the case that the resistance level is getting more of the wedge, after this case, we witness a downtrend in the market causing the market to keep to downtrend.
LUNAUSDT CHART - The chart in the image below shows the rising wedge structure in the market of LUNAUSDT.
ETHUSDT CHART - The chart in the image below shows the rising wedge structure in the market of ETHUSDT.
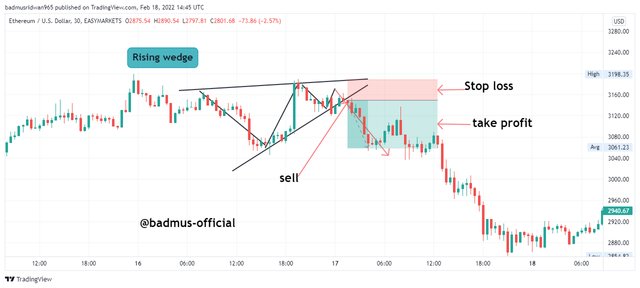
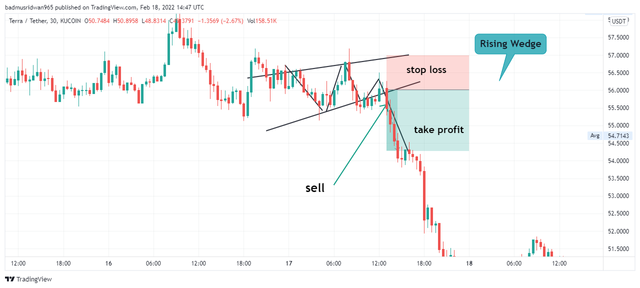
After discovering the market to be in a rising wedge, we get to place a trade to Sell to make a profit regarding the new coming trend, the entry-level was marked at the point the market crosses the edges and the stop loss level above the upper part of the wedge.
Falling wedge - The falling wedge is discovered mostly discovered in a downtrend market whereby we might be considered the bullish market will happen next. In the falling wedge, we get to witness little support from the wedge, then at the point, the wedge got exhausted a bullish trend mostly occurs.
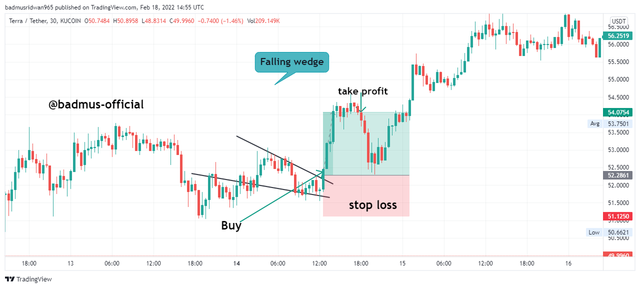
LUNAUSDT CHART - The chart in the image below shows the falling wedge structure in the market of LUNAUSDT.
ETHUSDT CHART - The chart in the image below shows the falling wedge structure in the market of ETHUSDT.
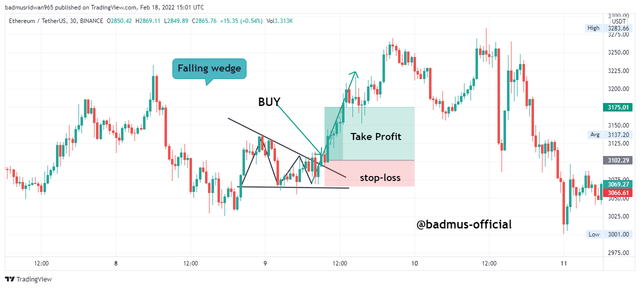
After which we were able to discover the falling wedge in the market, as said earlier, after a wedge, a new trend is expected to occur, after discovering our falling wedge, we place an order to BUY the market, as the bullish trend occurs, we also got to make a profit regarding the trend.
Technical analysis is as well as important as trading itself because, without proper technical analysis, one can end up making a bad decision regarding trade. let me list some usefulness of pattern technical analysis;
Help predict the market movement - with proper pattern structuring, traders can easily figure out what the market will possibly do next.
Smoothen market decision - just as we have witnessed from the writeup of the course is how we get to execute a trade using the pattern structuring, the crypto markets tend to always repeat themselves, so having a basic understanding of patterns can help traders smoothen their trading decision and as well expect the market to repeat itself and take the advantage of the repetition.
Help identifies trends - One thing that could never make a trade go wrong is identifying the current trend of the market, even though, not all indicators can depict the true trend of the market, with market structures, we can easily point to which trend is certain of occurring next.
Put the odds in our favor - we can combine indicators with the market pattern to increase the odds of winning as when we witness correlation with the market structure and indicator, that tends to give more confirmation of the position we are about to take in.
Yes, I found the application of the Double top and bottom effective and easy to use, as we have learned in the class that the double top is mostly recognized in a bullish market, which after the market repeats itself to another high peak framing the M structure, that could be the best position to exit the market, most especially when the market crosses the neck area, and the market starts depicting more lows signifies a bearish trend is about to occur, which with this, traders get to see the reversal of a trend early and fall out of the trade or might as well want to reconsider his market order to keep the market odd in his favor.
The pattern strategy also involves the use of falling and rising wedge which I as well found easy and effective to work with, in my argument, I would prefer the double top and bottom structuring to the wedges, as sometimes the wedges tend to show a continuation trend which is unlikely with the Double top and bottom as when the M and W structures are framed, there is no otherwise other than the trend reversal.
One more thing I would love to include in the use of the pattern to boost the effectiveness is to better still add the use of indicators, mostly technical indicators like RSI can help traders to know the volume of the trend and know the level at which the trend might get before taking the action of the trade executions with the market structure.
Now, we have come to the end of the course, here is a rundown summary of what has been explained so far on the topic "Double Top and Wedge Trading".
The Doube top and bottom pattern are the market structures framed on the chart to understand the market level of buy and sales, when these patterns are formed, the traders use the knowledge of the pattern structure to execute trades based on the description gotten from the pattern.
The Rising and falling wedge can also be used to understand the decision the market might take in next, the rising wedge depicts that a bearish trend is possible to occur while the falling wedge implies that a bullish trend might as well occur next.
Special mentioned to professor @imagen, its a well-detailed course which I was glad to be able to participate in.
Steemit Cryptography Student:
Gracias por participar en la Sexta Temporada de la Steemit Crypto Academy.
Espero seguir corrigiendo tus futuras asignaciones, un saludo.
Bittorrent Golden Wallet Prizes
For steemit users prizes are distrubuted based on their profile reputation Point. Don't get behind Sign in Now CLICK HERE and claim your Prizes now
Reputation Point based Prizes: