(XAU | USD) Forex Trading Analysis Today | Gold Analysis May 13, 2024 | XAUUSD Analysis

Forex Trading Analysis
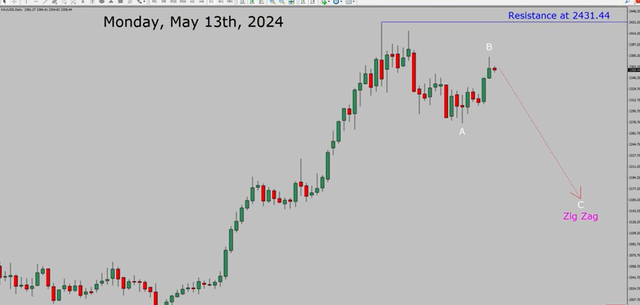
Hello, Guys today is Monday, May 13th 2024 I am going to analyze spot gold versus the US dollar pair let us start the top to bottom Elliot wave analysis inside the daily time frame the trend is down in spot gold daily time frame resistance is present at 2431.44 price level price action is the most likely going to drop to print bearish WC zigzag corrective leg in the coming trading days a decisive bullish breakout above 2431.44 resistance area is going to end down Trend in the daily chart of gold versus US dollar pair
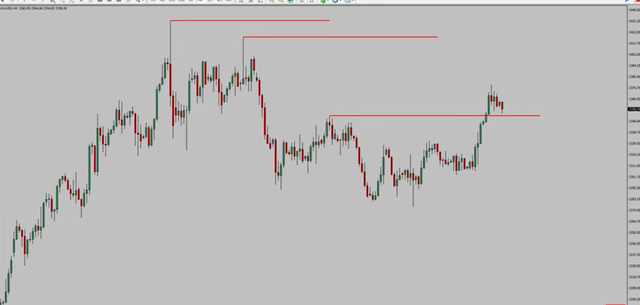
At 4=hour time frame price action manages to break above the most recent swing high to me spot gold Trend looks sideways in the 4hour time frame
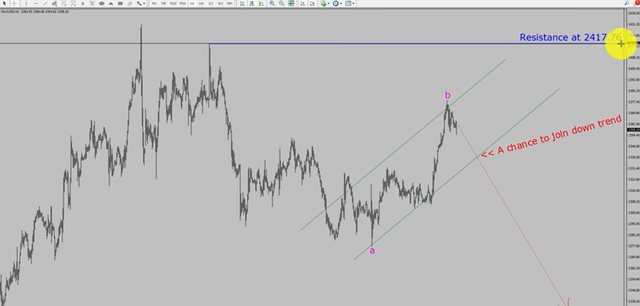
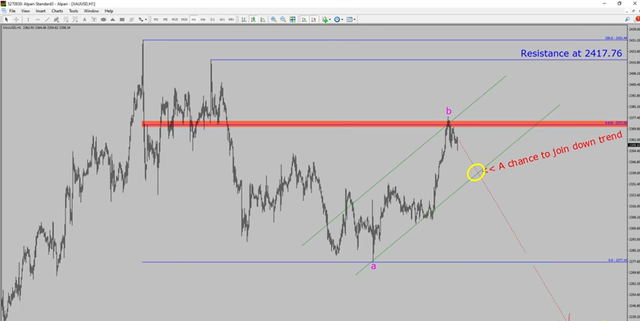
At 1 hour time frame the trend is down in 1-hour chart intraday resistance is present at 2417.76 price level price section is most likely going to drop to print bearish wave C zigzag corrective offers a chance to join the downtrend in Gold a decisive bullish breakout above 2417.76 resistance level is going to end down Trend in one hour chart of gold versus United States dollar pair
More specifically the red color highlights the area offers a selling opportunity which is the previous second wave of one lesser degree do not jump into the market with a sell trade wait for a bearish breakdown first
@muhammadfawad
Wow Nice Post.Keep it up.
Thank you bro!