(XAU | USD) Forex Trading Analysis Today | Gold Analysis April 29, 2024 | XAUUSD Analysis

Forex Trading Analysis
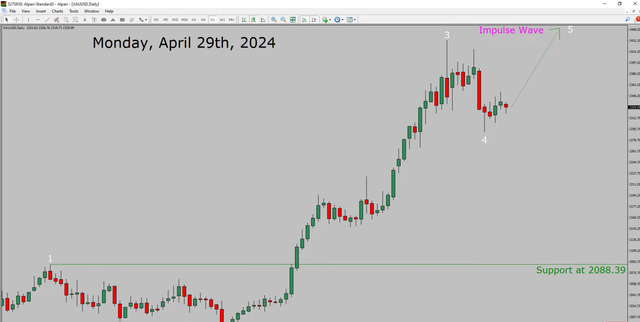
Hello, Guys, today is Monday, April 29th, 2024 I am going to analyze spot gold versus the US dollar pair let us start the top to bottom Elliot wave analysis inside the daily time frame the trend is up in spot gold daily time frame support is present at $288.39 price level price action is most likely going to move sideways and then rise more to complete bullish leg in coming trading days uh decisive bearish break below $288.39 support area is going to end uptrend in the daily chart of gold versus US dollar
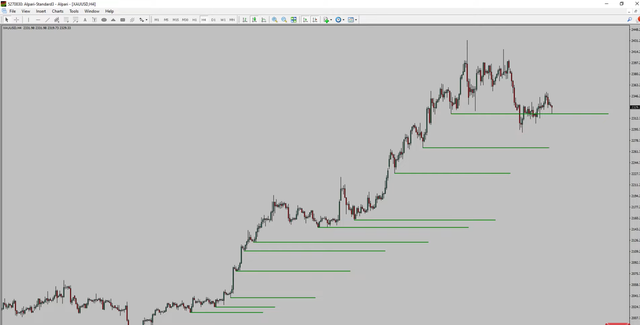
At a 4hour time frame price action manages to break below the most recent swing low to me, The spot gold Trend looks sideways in the 4hour time frame
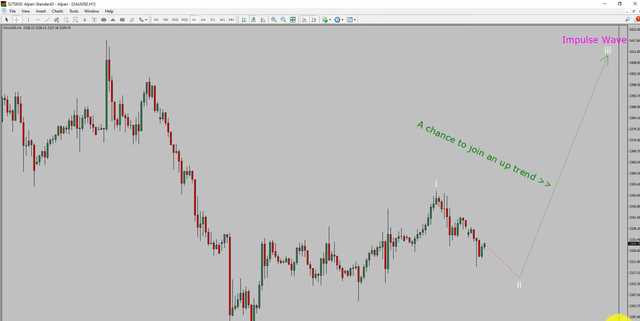
At 1-hour time frame the trend is up in 1-hour chart intraday support is present at $2291.20 price level price action is most likely going to drop to print the bearish wave to pull back and then rise to print the bullish wave three impulse leg which offers a chance to join an uptrend in gold at the decisive bearish break below $2291.20 support level is going to end uptrend in 1-hour chart of gold versus un States dollar
More specifically the green color highlighted area offers a buying opportunity which is the previous second wave of one lesser degree do not jump into the market with a Buy trade and wait for a bullish breakout
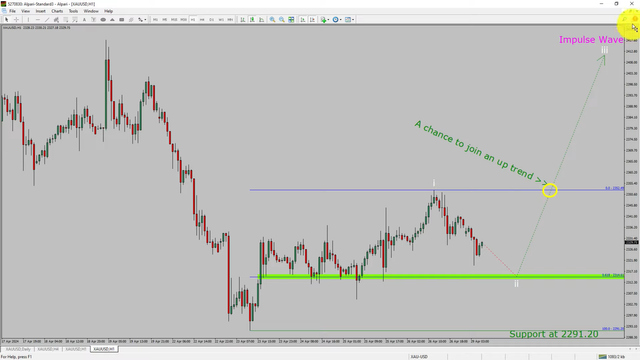
What if it fails to break through the resistance