Starting Crypto Trading - Crypto Academy / S6W1 - Homework post for pelon53
.png)

1.- In your own words, what is fundamental analysis? Do you think it is important for a trader? Justify the answer
Fundamental analysis is not only applied in the field of cryptocurrencies but also used by most business institutes. As we are in a crypto trading mindset we may focus on the fundamental analysis of cryptocurrencies. Fundamental Analysis depicts the objective value of an asset which gives its intrinsic value. As traders we all know that the cryptocurrency markets are highly volatile. The crypto assets should be evaluated in order to understand the asset in overvalued or undervalued. Price fluctuations can be seen in many well established coins. The fundamental analysis helps non-technical traders/investors to confidently trade in the market. The objective of crypto fundamental analysis is to reduce the risk of investors and evaluate the profit margin of the asset. There are three categories:
- Blockchain metrics
- Financial metrics
- Project metrics
To analyze the cryptocurrencies we can use many different methods. Let us see how each of them work.
- The white paper
The white paper is the most used method of analyzing a cryptocurrency. The whitepaper contains the information that any person needs to decide whether to invest in the asset or not. It contains the goal and objectives and the specifications of a particular asset.
- Target market
The target market is for what type of traders the asset is focusing. Depending on the traders/ investors surrounded the asset, the others who wish to invest on it can get the idea of what type of an asset are they going to invest or else they can measure the amount of volatility that asset has.
- Team
To analyze a cryptocurrency one can use the details about the team working on that asset. The skills, abilities and the capabilities of the team depict a lot about that asset. We can analyze the experience and past achievements of the team and predict how well will they work for this particular asset.
- Rumors
Rumors are what people talk about something just like word of mouth. But when analyzing a cryptocurrency these rumors are very important as the people talk about their past experiences they had and how much to invest as beginners etc..
2.- Explain what you understand by technical analysis and show the differences with fundamental analysis
Technical analysis is the most common analysis we do as traders to predict the price action of an asset before placing orders. Here we can use any mathematical indicators to forecast the future price of an asset with the aim of gaining profits. Different indicators show different shapes which gives the movement of price of an asset in past number of days. From the patterns those indicators predict that the price can be in a particular level according to the indicator pointing. But this can also fail due to sudden market fluctuations.
The investors/traders want to buy assets when the price is low and they want to sell when the price is high. The aim of all investors is to create the market volatility. There are number of indicators in technical analysis in trading platforms but different investors tend to choose their preferred indicator according to their knowledge and experience. Depending on the accuracy of the indicator they use the price signal may vary.
For example there are most common charts like line charts, candlestick charts and also indicators like RSI, MAs, trend lines and support resistance levels to help traders technically analyze their market. It is up to the trader/investor to use what is preferable.
Difference between Fundamental and Technical Analysis
| Fundamental Analysis | Technical Analysis |
|---|---|
| Use documentations and other data to analyze | use mathematical indicator to analyze |
| profitable for long term investments | profitable for short term investments |
| Use to identify the real value of an asset | use to identify the right time to enter to a trade |
| use past and present data | use only past data |
| Analyze report and other documents | analyze charts |
| Decisions based on evaluated documents | Decisions based on price trends and movements |
| use for investing | use for trading |
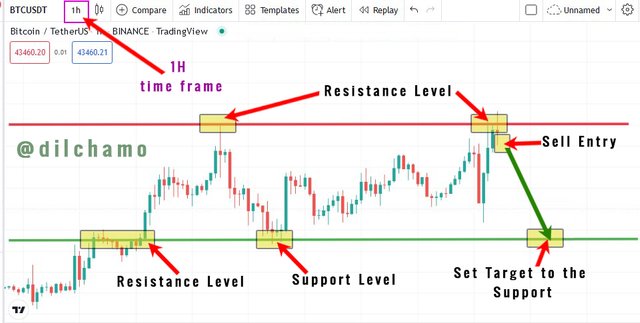
3.- In a demo account, execute a sell order in the cryptocurrency market, placing the support and resistance lines in time frames of 1 hour and 30 minutes. Screenshots are required
1 hour time frame
30 minutes time frame
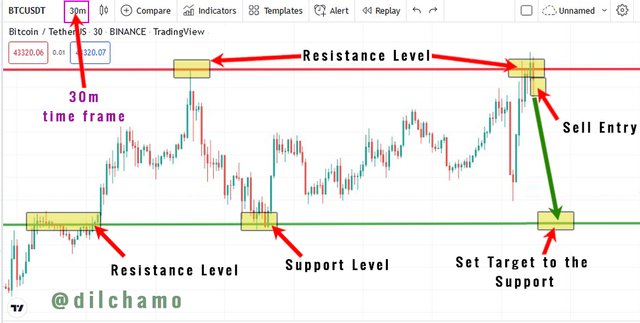
Here, I have selected the BTC/USDT crypto currency pair to execute the sell order. I have placed the support and resistance lines in both 1 hour and 30 minutes charts. As I can see a good rejection from the resistance level I have decided to place the sell order. I placed the target to the next support level as I think the price will pull back from that point.
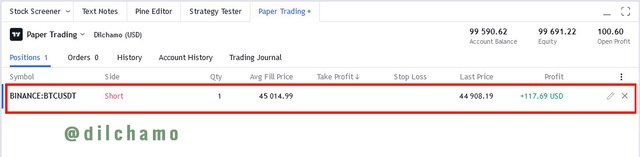
As you can see above, I have placed my short order. The average fill price is 45014.99$ and the last price is 44908.19$. So as you can see the current profit of the sell order is 117$.
4.- In a demo account, execute a buy order in the cryptocurrency market, placing the support and resistance lines in time frames of 1 day and 4 hours
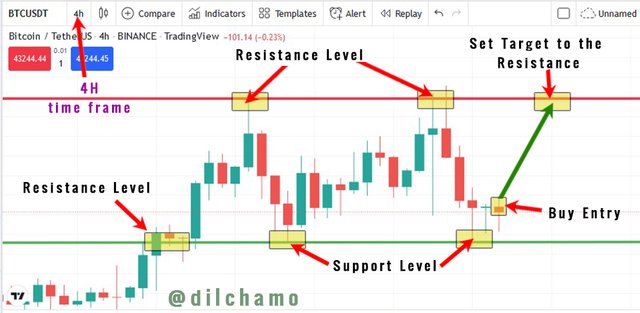
4 Hours time frame
1 Day time frame
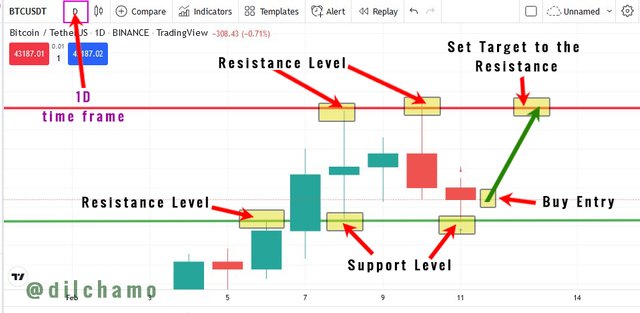
I have selected the BTC/USDT cryptocurrency pair to perform the buy order. I had to wait for three hours till I get a chance to place the order. I have identified the support and resistance levels and I placed the buy long order. I have set the target for the next resistance point as I think the price will break out from that point.
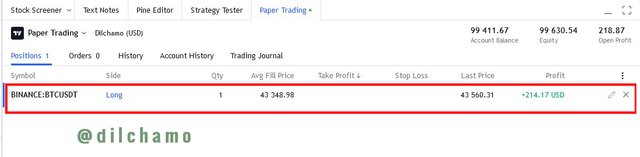
Here the average fill price is 43343.98$ and the last price is 43560.31$. I have received a profit of 214.17$ from this order.
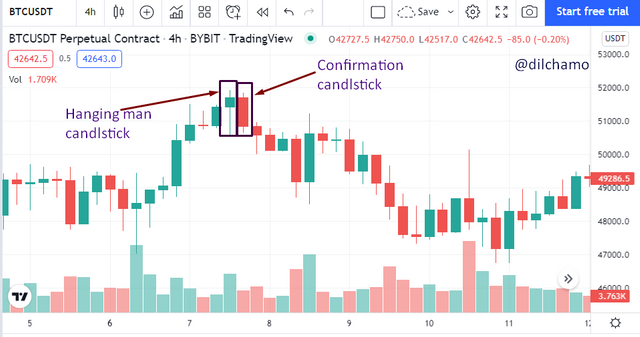
5.- Explain the “Hanging Man” and “Shooting Star” candlestick patterns. Show both candlestick patterns on a cryptocurrency market chart. Screenshot is required
Hanging man
“Hanging man” by its name says that it is a decline of price. This usually happens in a bullish trend signaling about a bearish trend soon. In this candlestick the body is slightly smaller than others and there is a long lower shadow with a very small upper shadow. In some candlestick the upper shadow is also not there. This is also known as a bearish reversal candlestick. Traders exit their buy trades and enter into sell trades once they get the hang man candlestick signal. The next candle after the hanging man candle will go lower in order to validate the price movement.
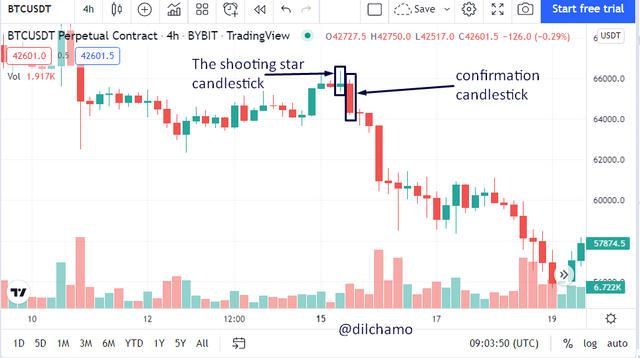
Shooting star
Shooting star is also a bearish candlestick which signals about price down trend. It has a long upper shadow and a small lower shadow. This shooting star appears after an uptrend. For it to be a shooting star the highest price point and the opening price point should be more than the size of the real body of that candlestick.
6.- Conclusion
In crypto trading it is a must to analyze the market before investing in assets. The technical and fundamental analyses are important ways to analyze the market price movement. The traders can gain profits without facing losses if a better analysis is done. The candlesticks like shooting star and the hanging man gives price breakout signals for traders to take trading decisions. Thank you professor @pelon53 for this nice lecture.