How are the witnesses performing? Or, how to be careful with time-series statistics
Last week, I wrote this article about trying to catch witnesses doing bad things. In it, I analyzed all the blocks produced by the top-producing witnesses over a long range of block production. During that time, almost all the witnesses had nearly identical statistics, except for two: @thecryptodrive and @netuoso. @thecryptodrive had surprisingly few transactions per block, and @netuoso had surprisingly many market transactions per block. What was going on?

It turns out that neither of those two witnesses had been witnessing full-time during the whole study period. The study period began with @thecryptodrive as a fulltime witness, and the study period ended with @netuoso as a fulltime witness. However, most of the other witnesses had been fulltime throughout the entire study period. How might this affect things?
The basis of my analysis assumed that each witness should see the same exact number and split of transactions as every other witness. Thus, if we look at which transactions each witness actually includes in blocks, we shouldn't be able to tell blocks produced by one witness apart from those produced by another witness.
However, the actual data ended up looking like this:
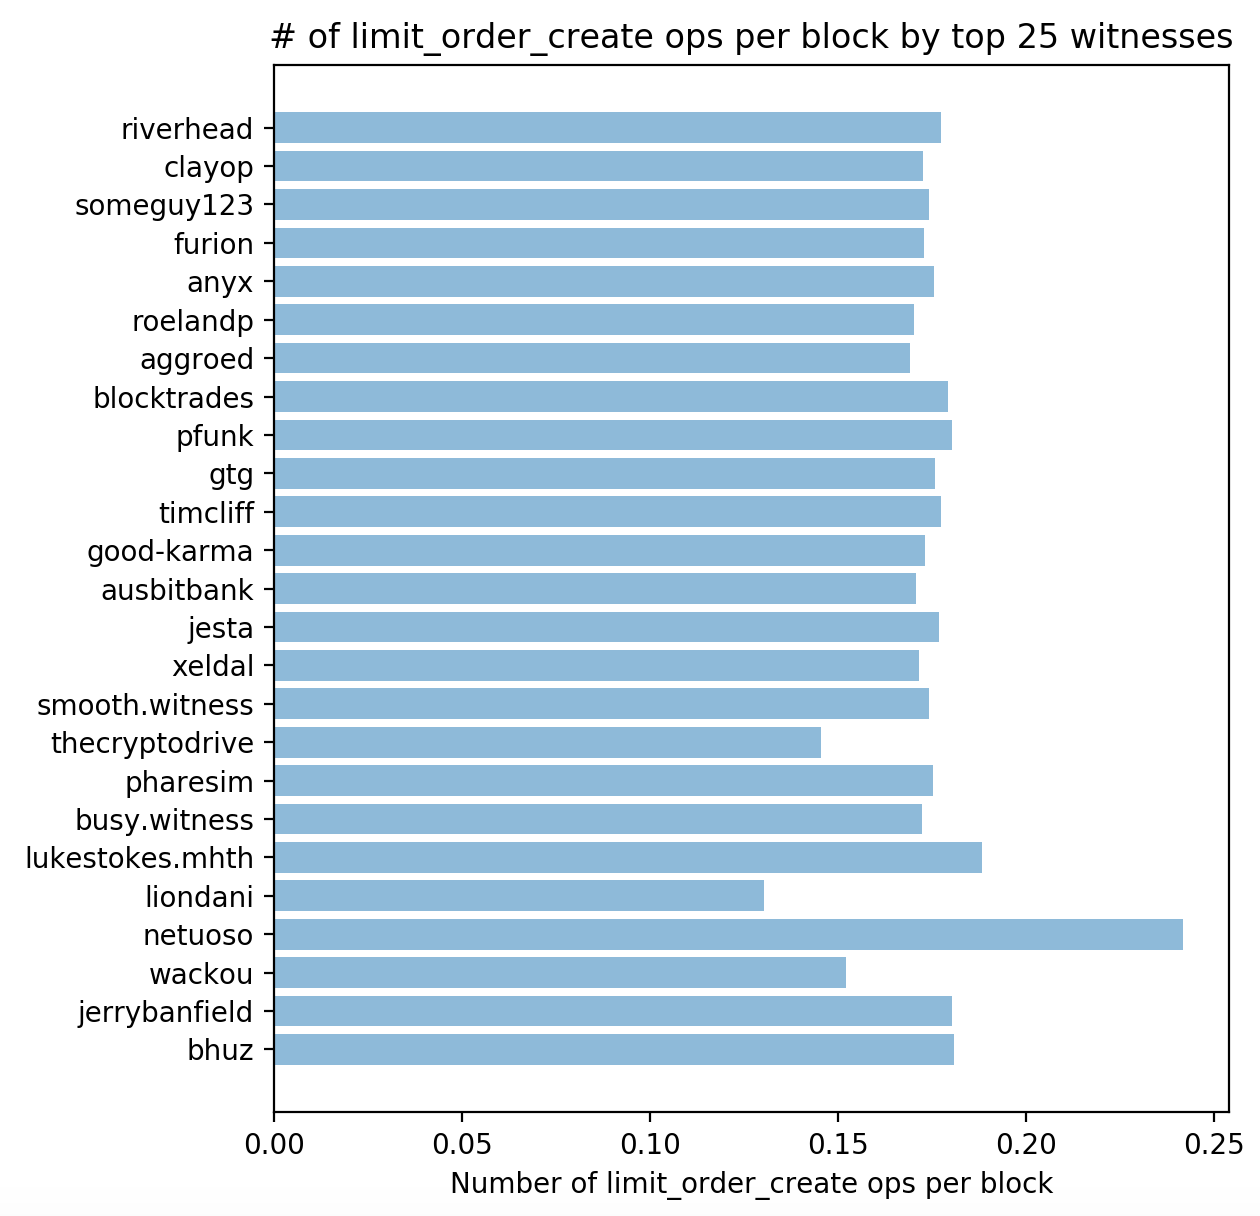
See how @thecryptodrive has many fewer market orders, but @netuoso has many more? Taken sloppily, this could mean that @netuoso was front-running market orders, which would not be good. However, the reality is much more nuanced.
Why @netuoso probably had a higher proportion of market orders than the others
It turns out that at the start of the study period (at block #17,000,000), @netuoso wasn't a fulltime witness. By the end of the study period (block #18,000,000), he was. However, almost every other witness was fulltime throughout the whole period. This means that if the frequencies of various order types changed during the study period, that would make it look like @netuoso is performing differently than the other witnesses. The fact that @netuoso wasn't fulltime throughout would bias the study against him.
So @netuoso is probably ok?
Right. Here's the same plot over a shorter time window that started around block #18,000,000: (covering about 4,000,000 blocks)
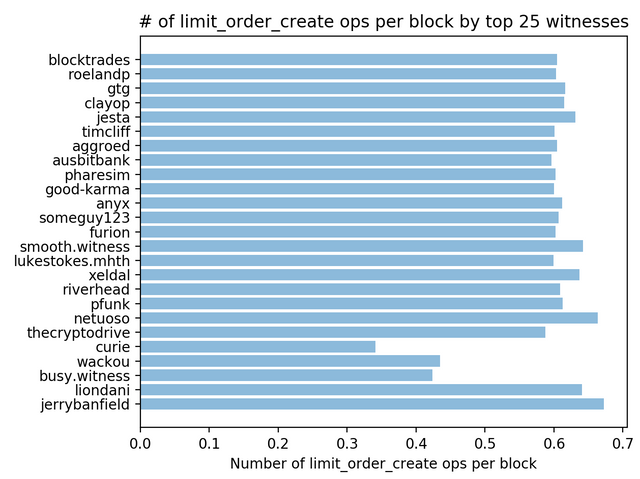
@netuoso still has more market orders than others, but only a tiny bit more -- and if he's in trouble, then so is @smooth.witness, @jesta, @xeldal, and @jerrybanfield.
So what's the right way to approach this in the future?
One improved way to do the statistics I was trying to do in my earlier post would be to look at each witness individually, and compare him/her to other witnesses in the same witness rounds. Part of the way Steem works is that block production is organized into rounds, or sequences of 21 consecutive blocks in which each witness produces exactly 1 block. Statistically, each witness should only be compared to other witnesses that shared rounds. That would be one way to unbias the results, because it would ensure that you're only comparing witnesses to others who should look the same.
Good!!!
I upvoted you’re content I hope you check out my profile aswell ;) !!
Strange !!!
What's going on here ???
Not much action here Phil sadly. I wonder why...
And plans to do the rounds comparison soon?
It's like #6 on my priority list, unfortunately. Also, the analysis should probably do more than just count operations -- and I haven't worked out the best way to do it yet.