[Tutorial]: Ionic App Development: Building the Business app part 6(Adding Live loading Charts)

Repository: Ionic Framework Github Repository
Software Requirements: Visual Studio Code(Or any preferred editor)
A browser(Preferably Chrome)
What you will learn:
In this tutorial you would learn how to live code a real ionic application with practical examples including these major concepts.
Utilizing javascripts event loop in ionic
Understanding common problems faced regarding blocking
Learning how to create and use charts in our ionic app.
Difficulty: Intermediate
Tutorial
Today we'd be dealing with more of the logic or back-end development of our ionic app. In this tutorial I would to my very best try to teach some major problems faced due to the fact that javascript is a single-threaded programming language and how this applies to ionic using a live example. So lets jump in;
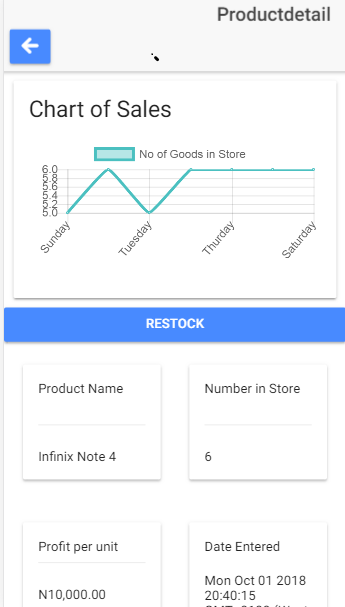
For our product detail page we would like to add a chart that shows the number of goods in the store over a period of time and since this isn't by default provided by ionic, we would have to use an external library called chart.js.
Just head to your console and run this command while connected to the internet to install all its dependencies.
npm install chart.js
Note: You should be in the directory of your app
After this you can directly use it by simply importing it into whatever page would require a chart. This module has many styles and designs for charts but for this case, we would be using the line chart.
You could click here for the official documentation if you wish to use any other style or read more extensively on this.
For a quick recap of what has changed.
I created a new page called the productdetailPage and injected it into our app as taught in earlier tutorials of this series, then i set a function on the product page to create a modal for anytime any product is clicked using this pages template.
I gave the page a simple front-end structure using the ion-grid and ion-card tags which are similar(if not identical) to bootstraps method of design.
This is the present template.
.png)
And this is the code for the template
productdetail.html


<ion-header>

  <ion-navbar>
    <ion-title text-right>Productdetail</ion-title>
    <button ion-button icon-only text-right (click)="dismisspage()"><ion-icon name="arrow-round-back"></ion-icon></button>
  </ion-navbar>

</ion-header>


<ion-content padding:10px>
  <ion-card>
    <ion-card-header>
      <h1>
        Chart of Sales
      </h1>
    </ion-card-header>
    <ion-card-content>
      <canvas #lineCanvas></canvas>
    </ion-card-content>
  </ion-card>
  <button ion-button block>Restock</button>
  <ion-grid>
    <ion-row>
      <ion-col>
        <ion-card>
          <ion-card-header>
        <h4>Product Name</h4><br><hr>
      </ion-card-header>
      <ion-card-content>
        <h5>{{ product.name }}</h5>
      </ion-card-content>
      </ion-card>
      </ion-col>
      <ion-col>
        <ion-card>
          <ion-card-header>
        <h4>Number in Store</h4><br><hr>
      </ion-card-header>
      <ion-card-content>
        <h5>{{ product.numOfGoods }}</h5>
      </ion-card-content>
      </ion-card>
      </ion-col>
    </ion-row>
    <hr>
    <ion-row>
      <ion-col>
        <ion-card>
          <ion-card-header>
        <h4>Profit per unit</h4>
        <hr>
      </ion-card-header>
      <ion-card-content>
        <h5>{{ product.profit | currency: 'N' }}</h5>
      </ion-card-content>
      </ion-card>
      </ion-col>
      <ion-col>
        <ion-card>
          <ion-card-header>
        <h4>
          Date Entered
        </h4>
      </ion-card-header>
      <ion-card-content>
        <h5>
          {{ product.timeOfEntry }}
        </h5>
      </ion-card-content>
      </ion-card>
      </ion-col>
    </ion-row>
  </ion-grid>
</ion-content>
So now we can go on to the logic.
For better understanding, let me go through some Javascript explanation.
Javascript runs on a single-threaded runtime, which means that it can only run one piece of code at a time. Although it is single threaded, it had other components such as web API's which are made with C++, that can be used to run other processes that aren't on the main stack.
Whenever processes are set to run on this API's however, they do no run on the main stack but are run separately and injected back onto the stack when they are done running by the call stack queue.
Hence Whenever a call is run off the stack it is called asynchronous and whenever it isn't it is called synchronous.
This explanation would come in handy in explaining why the code below seems bulky or is repeated for the if and else statements.
So back to our code.
To build a chart we have to create a canvas in the template and use ionic's ViewChild to link it up to the ts file. To do this simply import the viewchild.
import { Component, ViewChild } from '@angular/core';
And then link it up to your template by using the hash to refer to the canvas you created in the template.
productdetail.html

<canvas #lineCanvas></canvas>
and in the template use the viewChild like this
productdetail.ts

@ViewChild('lineCanvas') lineCanvas;
Due to the fact that the page we are creating is a modal, the data for each of the pages is going to be different and specific to the product that triggered the modal. This would mean that we would have to save each product data to storage using a different name that we'll set our code to create for us.
In the ionViewDidLoad() function, add this line of code which will create a name for the page based on the information passed to the modal.
let graphdataname = 'graphdata' + data.name;
This would be the key that our code will use to find the data for the page we're on.
Note: The storage functions are asynchronous calls, so whenever they are called they leave the stack and are run after the rest of the code is run. This is why our code has to be repetitive.
Also due to the fact that we'll be using storage, we would need to set code to be run if the storage is occupied or if it is empty.
Here is what we do
product.ts
import { Component, ViewChild } from '@angular/core';
import { IonicPage, NavController, NavParams } from 'ionic-angular';
import { Chart } from 'chart.js';
import { Storage } from '@ionic/storage';


@IonicPage()
@Component({
  selector: 'page-productdetail',
  templateUrl: 'productdetail.html',
})
export class ProductdetailPage {
  product: any;
  @ViewChild('lineCanvas') lineCanvas;

  lineChart: any;
  public graphdata: number[];

  constructor(public navCtrl: NavController, public navParams: NavParams, public storage: Storage) {
    this.product ={name: "",type: "",costprice: null,sellingprice:null,numOfGoods: 1,totalsellingprice: 0,profit: 0};
    this.graphdata = [];
  }


  ionViewDidLoad() {
    console.log('ionViewDidLoad ProductdetailPage');
    let data = this.navParams.get('item');
    let graphdataname = 'graphdata' + data.name;
    let newGraphData = data.numOfGoods;
    this.storage.get(graphdataname).then((name)=>{
      if(name){
        this.graphdata = name;
        console.log('There is data available');
        this.graphdata.push(newGraphData);
        this.storage.set(graphdataname, this.graphdata);
        this.lineChart = new Chart(this.lineCanvas.nativeElement, {

          type: 'line',
          data: {
              labels: ["Sunday","Monday", "Tuesday", "Wednesday", "Thurday", "Friday", "Saturday"],
              datasets: [
                  {
                      label: "No of Goods in Store",
                      fill: false,
                      lineTension: 0.1,
                      backgroundColor: "rgba(75,192,192,0.4)",
                      borderColor: "rgba(75,192,192,1)",
                      borderCapStyle: 'butt',
                      borderDash: [],
                      borderDashOffset: 0.0,
                      borderJoinStyle: 'miter',
                      pointBorderColor: "rgba(75,192,192,1)",
                      pointBackgroundColor: "#fff",
                      pointBorderWidth: 1,
                      pointHoverRadius: 5,
                      pointHoverBackgroundColor: "rgba(75,192,192,1)",
                      pointHoverBorderColor: "rgba(220,220,220,1)",
                      pointHoverBorderWidth: 2,
                      pointRadius: 1,
                      pointHitRadius: 10,
                      data: this.graphdata,
                      spanGaps: false,
                  }
              ]
          }

      });
      }
      else{
        console.log('There is no data available');
        let list = this.graphdata;
        list.push(newGraphData);
        this.storage.set(graphdataname, list);
        this.lineChart = new Chart(this.lineCanvas.nativeElement, {

          type: 'line',
          data: {
              labels: ["Sunday","Monday", "Tuesday", "Wednesday", "Thurday", "Friday", "Saturday"],
              datasets: [
                  {
                      label: "No of Goods in Store",
                      fill: false,
                      lineTension: 0.1,
                      backgroundColor: "rgba(75,192,192,0.4)",
                      borderColor: "rgba(75,192,192,1)",
                      borderCapStyle: 'butt',
                      borderDash: [],
                      borderDashOffset: 0.0,
                      borderJoinStyle: 'miter',
                      pointBorderColor: "rgba(75,192,192,1)",
                      pointBackgroundColor: "#fff",
                      pointBorderWidth: 1,
                      pointHoverRadius: 5,
                      pointHoverBackgroundColor: "rgba(75,192,192,1)",
                      pointHoverBorderColor: "rgba(220,220,220,1)",
                      pointHoverBorderWidth: 2,
                      pointRadius: 1,
                      pointHitRadius: 10,
                      data: this.graphdata,
                      spanGaps: false,
                  }
              ]
          }

      });
      }
    });

    console.log(this.graphdata);
    this.product = data;

  }

}
Because were using this asynchronous call we would have to run this code based on what we get from storage and by simply removing our chart from those calls, we would get a blank chart because the date would not be able to be called from the storage before using that data to run it.
To better understand this copy the code above and remove the code for the chart which is defined within
this.linechart = new Chart(this.lineCanvas.nativeElement{
    //code here
}
And place it after the if and else statement to see how it affects the chart.
This data is set to be modified each time the page is accessed and isn't a really good option, So it'll be better to load this data on the server side and send it to your app, or let this app generate this data after a certain period of time(such as a particular time of the day). In later parts of this series where we deal with server side interaction well cover how we could do that using more complex technicalities that we're yet to get into
See you next time and Hope this tutorial was helpful.
You can find my code in Github
Thank you for your contribution. Below is our review:
Your contribution has been evaluated according to Utopian policies and guidelines, as well as a predefined set of questions pertaining to the category.
To view those questions and the relevant answers related to your post, click here.
Need help? Write a ticket on https://support.utopian.io/.
Chat with us on Discord.
[utopian-moderator]
Thank you for your review, @mcfarhat!
So far this week you've reviewed 4 contributions. Keep up the good work!
Hello! I find your post valuable for the wafrica community! Thanks for the great post! We encourage and support quality contents and projects from the West African region.
Do you have a suggestion, concern or want to appear as a guest author on WAfrica, join our discord server and discuss with a member of our curation team.
Don't forget to join us every Sunday by 20:30GMT for our Sunday WAFRO party on our discord channel. Thank you.
As a follower of @followforupvotes this post has been randomly selected and upvoted! Enjoy your upvote and have a great day!
Hi @yalzeee!
Your post was upvoted by @steem-ua, new Steem dApp, using UserAuthority for algorithmic post curation!
Your post is eligible for our upvote, thanks to our collaboration with @utopian-io!
Feel free to join our @steem-ua Discord server
Hey, @yalzeee!
Thanks for contributing on Utopian.
We’re already looking forward to your next contribution!
Get higher incentives and support Utopian.io!
Simply set @utopian.pay as a 5% (or higher) payout beneficiary on your contribution post (via SteemPlus or Steeditor).
Want to chat? Join us on Discord https://discord.gg/h52nFrV.
Vote for Utopian Witness!