使用hcharts创建带标识的曲线图/How to use hcharts to make a curve chart(part 2)
Summary:
Javascript has a lot of open source chart Libraries,Hcharts.js is one of them,today i will show you how to create a curve chart by Hcharts.
Javascript 有很多开源图表库,Hcharts.js就是其中之一,今天教程将教大家如何使用Hcharts.js去绘制一张带标识的曲线图。
- 兼容浏览器:IE, Chrome,Firefox等等
您能从本教程学到什么?
- 代码整体结构
- 怎么调用hcharts.js
- 怎么设置图表画布大小和配置chart参数
- 怎么设置图表主副标题
- 怎么设置X\Y轴
- 怎么设置提示框
- 怎么设置通用配置
- 怎么设置数据列
需要的准备条件
- 你需要一个代码编辑器,比如atom,EmEditor等等,当然因为是文本编辑,可以直接通过浏览器打开,typora这类文本编辑器也可以进行代码编辑。
- 你需要下载hcharts.js(如果不下载到本地,也可以在线调用,参考要点2.)
本教程难度
相对来说比较简单,只需要对固定代码格式有些简单了解,就可以绘制带标识的曲线图。
- 认识简单代码
- 认识简单英文
教程内容
下面请先看一个简单例子:
要点1:代码整体结构
<html>
<head>
<meta charset="utf-8">
<title>title</title>
<script src="https://img.hcharts.cn/jquery/jquery-1.8.3.min.js"></script>
<script src="https://img.hcharts.cn/highcharts/highcharts.js"></script>
<script src="https://img.hcharts.cn/highcharts/highcharts-more.js"></script>
<script src="https://img.hcharts.cn/highcharts/modules/exporting.js"></script>
<script src="https://img.hcharts.cn/highcharts-plugins/highcharts-zh_CN.js"></script>
</head>
<body>
<div id="container" style="min-width: 310px; height: 400px; margin: 0 auto"></div>
<script>
    $(function () {
        $('#container').highcharts({
       //key code
        })
//hcharts.js  code area!
</script>
</body>
</html>
html结构,我们创建图表的代码是js语句,所以关键代码是放在< script>里面。下面将详细讲解关键代码。
要点2:怎么调用hcharts.js
<script src="https://img.hcharts.cn/jquery/jquery-1.8.3.min.js"></script>
<script src="https://img.hcharts.cn/highcharts/highcharts.js"></script>
<script src="https://img.hcharts.cn/highcharts/highcharts-more.js"></script>
<script src="https://img.hcharts.cn/highcharts/modules/exporting.js"></script>
<script src="https://img.hcharts.cn/highcharts-plugins/highcharts-zh_CN.js"></script>
如果本地没有hcharts.js库,可以使用其在线js资源,同时需要加载jquery.min.js。直接在head区域引用就可以了。
要点3:怎么设置图表画布大小和配置chart参数
<div id="container" style="min-width:400px;height:400px"></div>
在body区域,编辑chartjs代码之前,需要先定义下图表的大小。上面代码定义,最小宽度为400px,高为400px。
   chart: {
        type: 'spline'
    },
需要设置的参数只有一个,type,图表类型。默认值为 "line"。这里是曲线图,所以设置为spline。
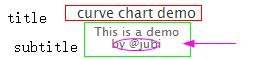
要点4:怎么设置图表主副标题
 title: {
        text: 'curve chart demo '
    },
title:标题,在text里输入标题,使用单引号括起来
 subtitle: {
        text: 'This is a demo <br/>by @jubi'
    },
title:副标题,在text里输入标题,使用单引号括起来,支持html标签,实例如下:
要点5:怎么设置X\Y轴
 xAxis: {
        categories: ['cat1', 'cat2', 'cat3', 'cat4', 'cat5', 'cat6',
                     'cat7', 'cat8', 'cat9', 'cat10', 'cat11', 'cat12'],
        title: {
            text: 'x-value-demo'
        },
    },
categories x轴刻度名称,显示在x轴下方。
title x轴标题 ,实例如下:

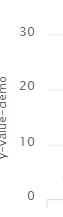
 yAxis: {
        title: {
            text: 'y-value-demo'
        },
        labels: {
            formatter: function () {
                return this.value;
            }
        }
    },
title y轴标题,显示在y轴左侧。
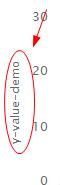
labels y轴刻度
formatter: function () {
                return this.value;
            }
返回数据值作为刻度。实例如下:
要点6:怎么设置提示框
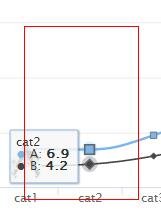
 tooltip: {
        crosshairs: false,
        shared: true
    },
crosshairs 瞄准属性,true和false2种参数,实例如下:
crosshairs: false
crosshairs: true

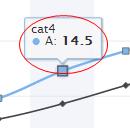
shared 共享提示框属性,true和false2种参数,实例如下:
- shared: true
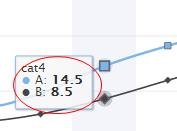
- shared: false
要点7:怎么设置通用配置
 plotOptions: {
        spline: {
            marker: {
                radius: 4,
                lineColor: '#666666',
                lineWidth: 1
            }
        }
    },
marker 曲线上数据点标识 :
radius 表示点大小
linecolor 颜色
linewidth 线宽
要点8:怎么设置数据列
 series: [{
        name: 'A',
        marker: {
            symbol: 'square'
        },
        data: [7.0, 6.9, 9.5, 14.5, 18.2, 21.5, 25.2, {
            y: 26.5,
            marker: {
                symbol: 'url(https://steemitimages.com/DQmX7LpH8Pgri2GqZv4cbQCbCLWawi1yuEDhAWWc9DctfgG/1.jpg)',
            }
        }, 23.3, 18.3, 13.9, 9.6]
    }]
name: 名称
marker 标识点设置
symbol 标识点形状
data 数据,格式:data:[data1,dta2,data3,data4,……]
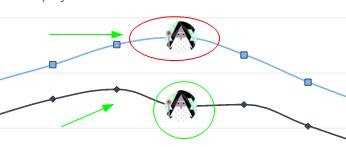
如果想把表示点改成小图标,也可以对数据进行单独marker参数设置 。
{
            y: 26.5,
            marker: {
                symbol: 'url(https://steemitimages.com/DQmX7LpH8Pgri2GqZv4cbQCbCLWawi1yuEDhAWWc9DctfgG/1.jpg)',
            }
        }
实例显示如下:
完整实例如下:
完整代码如下:
<html><head>
<meta charset="utf-8">
    <title>3D bubble chart</title>
    <script src="https://img.hcharts.cn/jquery/jquery-1.8.3.min.js"></script>
    <script src="https://img.hcharts.cn/highcharts/highcharts.js"></script>
    <script src="https://img.hcharts.cn/highcharts/highcharts-more.js"></script>
    <script src="https://img.hcharts.cn/highcharts/modules/exporting.js"></script>
    <script src="https://img.hcharts.cn/highcharts-plugins/highcharts-zh_CN.js"></script>
</head>
<body>
<div id="container" style="min-width:400px;height:400px"></div>
    <script>
var chart = Highcharts.chart('container', {
    chart: {
        type: 'spline'
    },
    title: {
        text: 'curve chart demo '
    },
    subtitle: {
        text: 'This is a demo <br/>by @jubi'
    },
    xAxis: {
        categories: ['cat1', 'cat2', 'cat3', 'cat4', 'cat5', 'cat6',
                     'cat7', 'cat8', 'cat9', 'cat10', 'cat11', 'cat12'],
        title: {
            text: 'x-value-demo'
        },
    },
    yAxis: {
        title: {
            text: 'y-value-demo'
        },
        labels: {
            formatter: function () {
                return this.value;
            }
        }
    },
    tooltip: {
        crosshairs: true,
        shared: false
    },
    plotOptions: {
        spline: {
            marker: {
                radius: 4,
                lineColor: '#666666',
                lineWidth: 1
            }
        }
    },
    series: [{
        name: 'A',
        marker: {
            symbol: 'square'
        },
        data: [7.0, 6.9, 9.5, 14.5, 18.2, 21.5, 25.2, {
            y: 26.5,
            marker: {
                symbol: 'url(https://steemitimages.com/DQmX7LpH8Pgri2GqZv4cbQCbCLWawi1yuEDhAWWc9DctfgG/1.jpg)',
            }
        }, 23.3, 18.3, 13.9, 9.6]
    }, {
        name: 'B',
        marker: {
            symbol: 'diamond'
        },
        data: [{
            y: 3.9,
            marker: {
                symbol: 'url(https://steemitimages.com/DQmX7LpH8Pgri2GqZv4cbQCbCLWawi1yuEDhAWWc9DctfgG/1.jpg)'
            }
        }, 4.2, 5.7, 8.5, 11.9, 15.2, 17.0, {
            y: 13.9,
            marker: {
                symbol: 'url(https://steemitimages.com/DQmX7LpH8Pgri2GqZv4cbQCbCLWawi1yuEDhAWWc9DctfgG/1.jpg)'
            }
        }, 14.2, 10.3, 6.6, 4.8]
    }, {
        name: 'C',
        marker: {
            symbol: 'diamond'
        },
        data: [{
            y: 13.9,
            marker: {
                symbol: 'url(https://steemitimages.com/DQmX7LpH8Pgri2GqZv4cbQCbCLWawi1yuEDhAWWc9DctfgG/1.jpg)'
            }
        }, 14.2, 15.7, 18.5, 21.9, 25.2, 27.0, {
            y: 23.9,
            marker: {
                symbol: 'url(https://steemitimages.com/DQmX7LpH8Pgri2GqZv4cbQCbCLWawi1yuEDhAWWc9DctfgG/1.jpg)'
            }
        }, 24.2, 20.3, 16.6, 14.8]
    }]
});
</script>
</body></html>
Posted on Utopian.io - Rewarding Open Source Contributors
Thank you for the contribution. It has been approved.
You can contact us on Discord.
[utopian-moderator]
Thank you ,its a demo .Use hcharts to create a curve chart, and mark some data on the curve.
so i use my profile picture. yeah its wizard, beacuse i like games. :)
These examples are already in the official documentation.
There are some adjustments.
You can contact us on Discord.
[utopian-moderator]
Hey @jubi I am @utopian-io. I have just upvoted you!
Achievements
Suggestions
Get Noticed!
Community-Driven Witness!
I am the first and only Steem Community-Driven Witness. Participate on Discord. Lets GROW TOGETHER!
Up-vote this comment to grow my power and help Open Source contributions like this one. Want to chat? Join me on Discord https://discord.gg/Pc8HG9x