How To Create Excel Spreadsheets Using NPOI
What Will I Learn?
Using NPOI, a free, open-source library for creating and reading Excel spreadsheets.
Requirements
- NPOI
- Microsoft Excel
Difficulty
Intermediate
Tutorial Contents
- An Overview of Excel and the Terminology Used in this Tutorial
- Creating Your First Excel Spreadsheet with NPOI
- Multiple Sheets, Styles, and Formulae
- Creating and Using Cell Styles
- Computing Cell Values Using Formulae
How To Create Excel Spreadsheets Using NPOI
To get started with NPOI you need the NPOI.dll assembly, which can be downloaded from the NPOI project page on CodePlex. Once you have the assembly, you'll need to add a reference to it in your web application by right-clicking on the website in Solution Explorer, choosing Add Reference, and then browsing to the assembly.
An Overview of Excel and the Terminology Used in this Tutorial
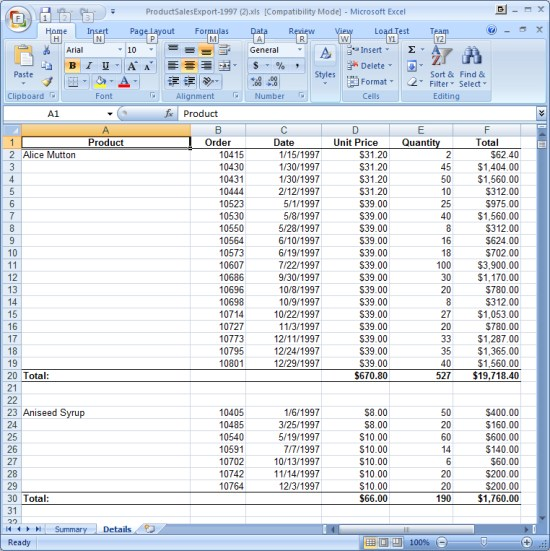
This tutorial includes a lot of jargon that not everyone may be familiar with. Before we dive into the meat of the article, I'd like to take a minute to define the terms I use in this tutorial so as to help avoid any confusion. Figure 1 shows an Excel spreadsheet, which is the entirety of the Excel document. This particular spreadsheet was generated by NPOI using code that is part of the demo available for download. In particular, the spreadsheet reports product sales from the Northwind database for 1997.
A spreadsheet contains a collection of sheets. The sheets are displayed as tabs at the bottom left corner of the spreadsheet. For example, the spreadsheet in Figure 1 has two sheets, Summary and Details, with the Details sheet being currently displayed.
A sheet is a collection of rows. The spreadsheet in Figure 1 shows rows 1 through 32, although in this particular sheet there are a total of 1,290 rows.
A row is a collection of cells. Cells can contain static values – text, numbers, dates, and so on – or they can hold formulae that report a computed value. Cells D20, E20, and F20 in Figure 1 have forumale that compute the summation of the Unit Price, Quantity, and Total amounts for the product (Alice mutton, in the case of cells D20, E20, and F20).
Figure 1: A spreadsheet is a collection of sheets, which is a collection of rows, which is a collection of cells.
Creating Your First Excel Spreadsheet with NPOI
NPOI's classes and interfaces model the components of an Excel spreadsheet. For example, the Workbook interface defines the properties and methods necessary for a spreadsheet. Similarly, the Sheet, Row, and Cell interfaces define properties and methods for the sheets, rows, and cells.
Creating an Excel spreadsheet with NPOI involves two high-level steps:
- Building the spreadsheet model, which involves constructing the necessary objects and setting their properties accordingly, and
- Converting the NPOI-representation of the spreadsheet into an actual Excel spreadsheet, which can be saved to the web server's file system or streamed directly to the visitor's browser.
To illustrate these two steps let's build an ASP.NET page that generates a rather simple Excel spreadsheet. In particular, let's create an Excel spreadsheet that lists the details about each user account on the website.
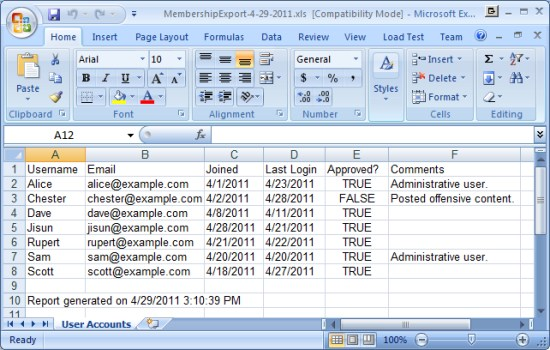
Before we look at the code itself, let's take a sneak peek at the final results so that our goal is clear. Figure 2 shows the generated Excel spreadsheet. There is a row for each user in the system listing their username, email, the date they joined, their last login date, whether or not they are approved, and any comments.
Figure 2: The Excel spreadsheet lists the details about each user on the site.
First, create a new ASP.NET page (or ASP.NET MVC Controller) and add the using statements in Listing 1. The first six using statements are for namespaces in the NPOI library. The System.IO namespace is useful because very often you'll want to take the spreadsheet created via the NPOI library and either save it to disk or to a MemoryStream whose contents will be streamed down to the browser.
1: Add these using statements to your class file.
using NPOI.HSSF.UserModel;
using NPOI.SS.UserModel;
using NPOI.SS.Util;
using NPOI.HSSF.Util;
using NPOI.POIFS.FileSystem;
using NPOI.HPSF;
using System.IO;
using System.Web.Security;
Next, we need to get the details about all of the user accounts on the website. Presuming you are using ASP.NET’s Membership system you can use the Membership.GetAllUsers method to retrieve a complete list of users (which is why I included the System.Web.Security namespace in Listing 1).
2: Retrieve details about the users on your site.
// Get the data to report on
var userAccounts = Membership.GetAllUsers();
We're now ready to start building the spreadsheet! NPOI's HSSFWorkbook class models an Excel spreadsheet; consequently, programmatically creating a spreadsheet using NPOI starts with creating a new HSSFWorkbook object. Once we have a workbook object at the ready we can add sheets to it by calling the CreateSheet method, which returns an object that implements the Sheet interface.
The code in Listing 3 creates a new workbook object and then adds a single sheet named "User Accounts."
3: Create a new workbook object and add a sheet.
// Create a new workbook and a sheet named "User Accounts"
var workbook = new HSSFWorkbook();
var sheet = workbook.CreateSheet("User Accounts");
Next we need to create the header row, which labels the data points displayed for each user – Username, Email, and so forth. To add a row to a sheet use the Sheet's CreateRow method, passing in the index of the row. CreateRow returns an object that implements the Row interface. Using this row object you can add one or more cells to the row by calling its CreateCell method. Similarly, CreateCell returns an object that implements the Cell interface. The cell object has a variety of methods and properties, one of the most germane being SetCellValue, which assigns a value to the cell.
The code in Listing 4 generates the header row. It starts by creating a new row in position 0. Next, the row's CreateCell method is called six times to create the six cells for the header row. Each cell has its value assigned – Username, Email, etc. – via the SetCellValue method.
Because the CreateCell method returns an object that implements the Cell interface you can use method chaining to call the SetCellValue. This is a useful shortcut if you don't need to call any other methods of the cell or assign any of its properties. Also, note that the index for both CreateRow and CreateCell starts at zero. To add the first row – which is labelled as row 1 in the Excel spreadsheet – you'd call CreateRow(0).
4: Create the header row and its cells.
// Add header labels
var rowIndex = 0;
var row = sheet.CreateRow(rowIndex);
row.CreateCell(0).SetCellValue("Username");
row.CreateCell(1).SetCellValue("Email");
row.CreateCell(2).SetCellValue("Joined");
row.CreateCell(3).SetCellValue("Last Login");
row.CreateCell(4).SetCellValue("Approved?");
row.CreateCell(5).SetCellValue("Comments");
rowIndex++;
We're now ready to add the data rows – namely, those rows that represent the user accounts on the website. This is done by looping through the collection of MembershipUser objects in userAccounts and adding a new row with cells that hold the values for each user's fields of interest – Username, Email, and so on (see Listing 5). The rowIndex variable, created and initialized to 0 in Listing 4, is incremented at each step through the loop and instructs NPOI where to place the new row.
5: A row is added to the sheet for each user account.
// Add data rows
foreach (MembershipUser account in userAccounts)
{
    row = sheet.CreateRow(rowIndex);
    row.CreateCell(0).SetCellValue(account.UserName);
    row.CreateCell(1).SetCellValue(account.Email);
    row.CreateCell(2).SetCellValue(account.CreationDate.ToShortDateString());
    row.CreateCell(3).SetCellValue(account.LastLoginDate.ToShortDateString());
    row.CreateCell(4).SetCellValue(account.IsApproved);
    row.CreateCell(5).SetCellValue(account.Comment);
    rowIndex++;
}
There are two minor steps that I've omitted from Listings 1 through 5 for brevity – namely, adding the "Report generated on ..." message after the last user account and auto-sizing each of the columns – but other than those unessential tasks we've got our spreadsheet constructed in NPOI.
At this point we need to decide what to do with this in-memory representation of a spreadsheet. Do we want to save it to the web server's harddrive or do we want to stream it directly to the visitor? The workbook object has a Write method that will save the Excel spreadsheet to a Stream of our choosing. For example, to save the spreadsheet to a file use the code in Listing 6.
6: Save the spreadsheet to a file on the web server’s file system.
// Save the Excel spreadsheet to a file on the web server's file system
using (var fileData = new FileStream(filename, FileMode.Create))
{
    workbook.Write(fileData);
}
Streaming the Excel spreadsheet back to the client so that it will open in the browser takes a bit more work as we have to:
- Tell the browser that we're sending it a Microsoft Excel spreadsheet (as opposed to an HTML document),
- Instruct the browser to treat this as an attachment so that is will open the View / Save As dialog box, and
- Send the contents of the spreadsheet back to the client in the response.
These three steps are handled by the code in Listing 7, which starts by creating a new MemoryStream object. The spreadsheet is then "saved" to this MemoryStream via the workbook's Write method. Next, the Response object's Content-Type and Content-Disposition HTTP headers are configured (steps 1 and 2 above) and then the contents of the spreadsheet are streamed down to the client via a call to Response.BinaryWrite (step 3). Note that the Content-Disposition header is set such that the browser will suggest saving the spreadsheet using the filename MembershipExport-date.xls, where date is the month, day, and year the report was run; for example, MembershipExport-4-29-2018.xls.
7: The Excel spreadsheet is saved to a MemoryStream and streamed to the client.
// Save the Excel spreadsheet to a MemoryStream and return it to the client
using (var exportData = new MemoryStream())
{
    workbook.Write(exportData);
    string saveAsFileName = string.Format("MembershipExport-{0:d}.xls", DateTime.Now).Replace("/", "-");
    Response.ContentType = "application/vnd.ms-excel";
    Response.AddHeader("Content-Disposition", string.Format("attachment;filename={0}", saveAsFileName));
    Response.Clear();
    Response.BinaryWrite(exportData.GetBuffer());
    Response.End();
}
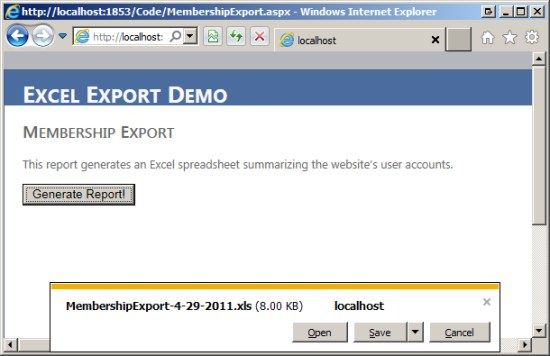
Figure 3 shows the effects of the code in Listing 7 when viewed through Internet Explorer 9. Here, the user has clicked the Generate Report button, which triggered a postback. On postback, the Excel spreadsheet was created, saved to a MemoryStream, and streamed back to the browser. The browser then prompts the user whether to open the file (MembershipExport-4-29-2018.xls) or to save it.
Figure 3: The user is prompted to open or save the generated Excel spreadsheet.
Multiple Sheets, Styles, and Formulae
The membership report Excel spreadsheet is rather simple and dull. It is composed of a single sheet, employs no formatting, and does not require the use of any formulae. Let's look at a more interesting example.
The demo available for download includes a sales data report from the Northwind database. In short, a user can select the year of sales that interest them and then an Excel spreadsheet is generated that contains two sheets:
- Summary, which lists the total sales for the year across all products (a single number) and breaks out the sales for each product, and
- Details, which lists every single sale for the year – the order, date, price, quantity, and total – grouping the sales by product.
Additionally, this generated spreadsheet includes a variety of style settings not seen in the previous example, including:
- Alignment,
- Borders,
- Formatting, and
- Font weight
And the spreadsheet makes use of formulae, as well. The styles and formulae can be seen in action in Figure 1. For instance, the text in row 20 is bold and has a thin top and bottom border. Cells D20, E20, and F20 each use Excel's SUM formula to sum the figures in their respective columns. And the figures in the D and F columns are formatted as currency values.
The remainder of this tutorial shows how to create and apply styles to cells and how to have a cell's value computed via a formula. Download the demo for a complete working example.
Creating and Using Cell Styles
Applying style settings to a cell involves the following steps:
- Create a new object that implements the CellStyle interface,
- Set the object's various properties, and
- Assign the object to the cell's CellStyle property.
Step 1 is accomplished by calling the workbook's CreateCellStyle method, which creates and returns the object used in steps 2 and 3. Listing 8 shows the code used to create the style for the subtotal row in the Details sheet – namely, the style used on row 20 – along with the code that assigns this style to the cells in the subtotal row.
8: The cell style for the subtotal row is created, configured, and assigned to the appropriate cell.
// Create the style object
var detailSubtotalCellStyle = workbook.CreateCellStyle();
// Define a thin border for the top and bottom of the cell
detailSubtotalCellStyle.BorderTop = CellBorderType.THIN;
detailSubtotalCellStyle.BorderBottom = CellBorderType.THIN;
// Create a font object and make it bold
var detailSubtotalFont = workbook.CreateFont();
detailSubtotalFont.Boldweight = (short)FontBoldWeight.BOLD;
detailSubtotalCellStyle.SetFont(detailSubtotalFont);
...
// Add a row for the detail row
row = sheet.CreateRow(rowIndex);
// Create the first cell – "Total" – and apply the style
cell = row.CreateCell(0);
cell.SetCellValue("Total:");
cell.CellStyle = detailSubtotalCellStyle;
// Create the second cell for the Order column, which is empty in this row
cell = row.CreateCell(1);
cell.CellStyle = detailSubtotalCellStyle;
Listing 8 shows just the first two cells in the subtotal row having their CellStyle property set to the detailSubtotalCellStyle object. Keep in mind that this style is also assigned to the other cells in this row – cells C through F – but these assignments are omitted from Listing 8 for brevity.
Create Each Distinct Style Once, Not Once Per Cell
Note how in Listing 8 the detailsSubtotalCellStyle style object is created once and then assigned multiple times – once to the "Total" cell, once to the second cell in the row, and so on. When applying styles it's important to create the shared style once and then assign it to the needed cells rather than creating a new style with identical settings for each cell. The reason is because each style object you create – even if it has the same settings as another style object – is recorded in the Excel spreadsheet, and Excel has a limit on how many different cell styles it supports. Consequently, if you have a spreadsheet with many cells and you create a new style object for each cell you may bump into this limitation.
You can also use the style object to define a format string for the cell's value via the style object's DataFormat property. Listing 9 shows the code used to create the currencyCellStyle style object, which is is used for the detail records in columns D and F. Specifically, the style uses a DataFormat property setting that formats the cell's value as a currency.
9: The style’s DataFormat property is used to display the cell’s text as a currency.
// Create the style object
var currencyCellStyle = workbook.CreateCellStyle();
// Right-align currency values
currencyCellStyle.Alignment = HorizontalAlignment.RIGHT;
// Get / create the data format string
var formatId = HSSFDataFormat.GetBuiltinFormat("$#,##0.00");
if (formatId == -1)
{
    var newDataFormat = workbook.CreateDataFormat();
    currencyCellStyle.DataFormat = newDataFormat.GetFormat("$#,##0.00");
}
else
    currencyCellStyle.DataFormat = formatId
Excel has a number of built-in formats. The code in Listing 9 starts by checking to see if the format string of interest - $#,##0.00 – is a built-in format by calling the HSSFDataFormat.GetBuiltinFormat method. If this format exists, its ID is returned and assigned to the style object's DataFormat property. If the format does not exist a new format object is created by calling the workbooks' CreateDataFormat method and defining its format string.
Computing Cell Values Using Formulae
In the examples we've seen thus far, we've assigned a value to a cell using the SetCellValue method. This works well when displaying a static value in the cell, but part of Excel's power is its ability to use formulae. By assigning a formula to a cell (rather than a hard-coded value), the cell's value is updated automatically when the values of the cells it references are modified.
To assign a formula to a cell, set the cell's type to FORMULA via the SetCellType method and then specify the formula via the CellFormula property. Listing 10 shows the code used to assign the formula to the D column in the subtotal row of the Details sheet, which is the summation of the unit price values for the current product. This is accomplished using Excel's SUM formula, which takes the format: SUM(startCell, endCell). The startRowIndexForProductDetails and rowIndex variables present in Listing 10 mark the first and last row indexes of the current product and are used to craft the formula so that the for the subtotal row ranges over the unit price values for the current product. For instance, for the 1997 sales report for Alice Mutton the resulting formula is SUM(D2:D19).
10: The SetCellType method and CellFormula property are used to craft the formula for the subtotal row’s Unit Price column.
cell = row.CreateCell(3);
cell.SetCellType(CellType.FORMULA);
cell.CellFormula = string.Format("SUM(D{0}:D{1})", startRowIndexForProductDetails + 1, rowIndex);
Because the cells in the D, E, and F columns in the subtotal rows use formulae and not a hard-coded value, if the user manually modifies the detail values in any of those columns the subtotal values will automatically update to reflect the change.
Conclusion
There are a variety of ways to programmatically create an Excel spreadsheet from an ASP.NET website. This tutorial explored one particular approach – using NPOI, a free, open-source library for working with Excel spreadsheets. With NPOI and a bit of code, you can create spiffy looking, multi-sheet Excel spreadsheets rich with formatting, styling, and forumlae. And, while not explored in this tutorial, NPOI can also be used to read the contents of existing Excel spreadsheets.
Happy Programming!
Posted on Utopian.io - Rewarding Open Source Contributors
Thank you for the contribution. It has been approved.
You can contact us on Discord.
[utopian-moderator]
Hey @haig I am @utopian-io. I have just upvoted you!
Achievements
Suggestions
Get Noticed!
Community-Driven Witness!
I am the first and only Steem Community-Driven Witness. Participate on Discord. Lets GROW TOGETHER!
Up-vote this comment to grow my power and help Open Source contributions like this one. Want to chat? Join me on Discord https://discord.gg/Pc8HG9x