Exploring WorldPop GIS data with R
This is a small introduction to WorldPop data and its use with R GIS packages such as raster and rgdal. WorldPop is a project that attempts to estimate population at high resolution (each pixel is approximately 100m x 100m) using satellite images, geolocated covariates and census data. This comes handy specially in countries where census data is not available for recent years. Guatemala is one of these use cases. Its last census was in 2002 and it will have another census next year (hopefully). I'm currently working in a project that requires population estimations for each municipality in 2015 so I'll show you how I got these estimations with WorldPop data.
To do this we need two things: the WorldPop raster data (a TIFF file) and the municipalities polygons (shapefile, georss, geojson, or any other format).
First let's load the packages we'll use. We are going to plot using basic R plots and ggplot2 in order to show how to use both methods.
library(rgdal)
library(raster)
library(sp)
library(colorRamps)
library(ggmap)
library(ggplot2)
Load the data of Guatemala for 2015. This data is basically a raster with numbers ranging from 0 to about 100, which represent the estimated population for each pixel. Thus, we only need to sum over each municipality geometry in order to get the estimated population.
WorldPopGT <- raster("C:/DATOS/WorldPop/GTM_ppp_v2b_2015/GTM_ppp_v2b_2015.tif")
I got a shapefile from some government office called SEGEPLAN, but it is most probably outdated since it only lists 334 items, while there are currently (as of Dec 2017) 340 according to Wikipedia. Originally I used this shapefile but a while ago I obtained some data from the IGN (national geographic institute of Guatemala) which seems to be more up to date. This file was retrieved in mid 2017 and has been uploaded to the internet archive so it is accesible. The link is mentioned below and the blog post describing this data fetching is here.
# Old data from SEGEPLAN data. This only contains 334 municipalities.
gtmMunis = readOGR("../../Guillermo/GIS/municipios_gtm/municipios_GTM.shp", encoding = "utf-8")
## OGR data source with driver: ESRI Shapefile
## Source: "../../Guillermo/GIS/municipios_gtm/municipios_GTM.shp", layer: "municipios_GTM"
## with 337 features
## It has 12 fields
# This data comes from IGN GIS system. It contains 340 Municipalities. It seems to be less outdated.
# This file can be found in the archive: https://archive.org/download/IGNCartografiaBasicaDivisionPoliticaAdministrativaMunicipios/IGN-cartografia_basica-Division%20politica%20Administrativa%20%28Municipios%29.geojson
gtmMunisIGN = readOGR("../TempData/IGN-cartografia_basica-Division politica Administrativa (Municipios).geojson", encoding="utf-8")
## OGR data source with driver: GeoJSON
## Source: "../TempData/IGN-cartografia_basica-Division politica Administrativa (Municipios).geojson", layer: "IGN-cartografia_basica-Division politica Administrativa (Municipios)"
## with 344 features
## It has 6 fields
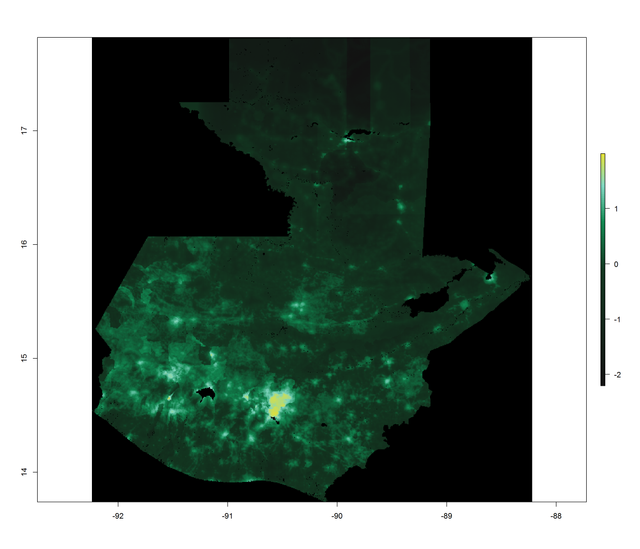
Next I'd like to show a beautiful raw visual overview of the whole country and its population distribution. It is worth mentioning that I spent a while tweaking the color scale in order to be able to visually recognize very low counts and high counts. Counts are transformed with log10 function, which means that 2 is equivalent to 100 inhabitants, 1 is 10, 0 is 1 and less than zero is less than 1 habitant per pixel. This plot has been generated with basic R functionality.
plot(log10(WorldPopGT), colNA="black", col=colorRampPalette(c("#121212", "#123620", "#108650", "#80D6C0", "#DFDF3B"),0.5)(110))
Now let's estimate, for the sake of example, the population in Guatemala department. Result is 3.4 million people using both geographical polygons, the one that is outdated and the one that is up to date. This should show very similar results since this district has not changed in time.
print(sum(extract(WorldPopGT, gtmMunis[gtmMunis$Cod_Dep==1,], fun = sum, na.rm = TRUE ) ))
## [1] 3439633
print(sum(extract(WorldPopGT, gtmMunisIGN[gtmMunisIGN$COD_DEPT__ %in% c("01"),], fun = sum, na.rm = TRUE ) ))
## [1] 3436954
There seems to be a large diference, in the order of thousands of inhabitants. Let's just say I'll trust more in the IGN shapefile result.
What about the population of the entire country?
tempdata = as.array(WorldPopGT)
sum(tempdata, na.rm = T)
## [1] 15929699
Result is 15.9 million. National statistics institute of Guatemala projections estimate this number to be 16176034 for 2015. I would believe more in this data since it is based on other covariates, while INE projections are based on a raw population growth rate, which is probably estimated from official data on live births and deaths and not on any up to date covariate.
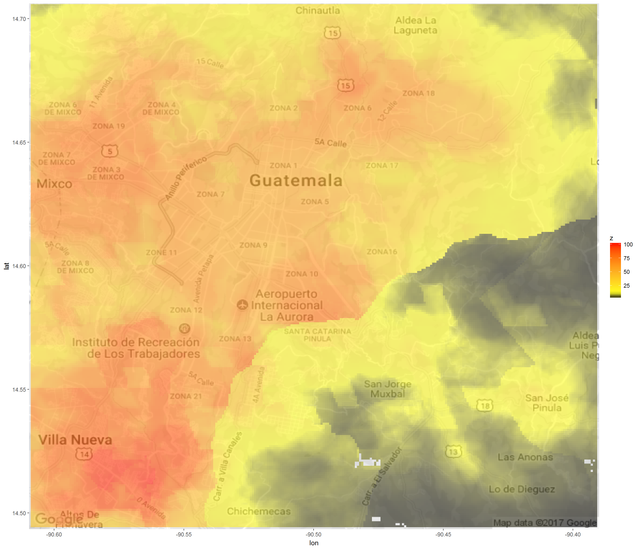
Plotting googlemaps and WorldPop rasters together
Now I'd like to show off a nice snippet that allows us to explore this data with google maps images. You may just change the location and zoom values in the get_map function call:
gmap = get_map(location=c(-90.50,14.60), zoom=12, scale=1, maptype = "roadmap", source="google", color="bw")
gmapbbox = attr(gmap, "bb")
subpop <- crop(WorldPopGT, extent(gmapbbox$ll.lon, gmapbbox$ur.lon, gmapbbox$ll.lat, gmapbbox$ur.lat))
subpopDF = data.frame(rasterToPoints(subpop))
colnames(subpopDF) = c("lon", "lat", "z")
bm = ggmap(gmap)
bm = bm + geom_raster(data = subpopDF, aes(y=lat, x=lon, fill=z), alpha=0.6) +
    scale_fill_gradientn(colours=rev(c("#FF1202FF", "#FDAD22FF", "#FDFD22FF", "#00000077")), values = c(0,0.1,0.5,1) ) + coord_cartesian()
plot(bm)
Now let's finally get the population for each municipality, which is what brought me here in the first place:
# This takes a while, so I'm ignoring the old and outdated SEGEPLAN shapefile data.
# munisPop = extract(WorldPopGT, gtmMunis[gtmMunis$Codigo > 0 & gtmMunis$Cod_Dep<23,], fun = sum, na.rm = TRUE )
munisPopIGN = extract(WorldPopGT, gtmMunisIGN[!(gtmMunisIGN$COD_DEPT__ %in% c(NA)) & !(gtmMunisIGN$COD_MUNI__ == 0),], fun = sum, na.rm = TRUE )
The geometries files have some invalid municipalities, so we have to ignore those. Let's now put the data in the municipalities database and exporting to a CSV.
#gtmMunis[gtmMunis$Codigo > 0 & gtmMunis$Cod_Dep<23, "Poblacion"] = munisPop
gtmMunisIGN[!(gtmMunisIGN$COD_DEPT__ %in% c(NA)) & !(gtmMunisIGN$COD_MUNI__ == 0), "Poblacion"] = munisPopIGN
write.csv(gtmMunisIGN[, names(gtmMunisIGN)], "Guatemala_Municipios_IGN2017_worldpop2015.csv")
The result was uploaded to the internet archive: https://archive.org/details/GuatemalaMunicipiosIGN2017Worldpop2015
In conclusion, WorldPop data is quite easy to integrate with other GIS data and it provides, in my opinion, better population estimates than simple projections based on really old census data. I've also made this same procedure with python by using rasterio and fiona packages and I might upload that in a few days. The numerical results between python and R are a bit different, by a few hundreds of inhabitants. Hope you learned something from this introductory and basic tutorial and that this encourages people to get started working with WorldPop's open data.
Posted on Utopian.io - Rewarding Open Source Contributors
This is a very interesting tutorial, I never have heard about WorldPop. Thanks.
Hey @elguille I am @utopian-io. I have just upvoted you!
Achievements
Suggestions
Get Noticed!
Community-Driven Witness!
I am the first and only Steem Community-Driven Witness. Participate on Discord. Lets GROW TOGETHER!
Up-vote this comment to grow my power and help Open Source contributions like this one. Want to chat? Join me on Discord https://discord.gg/Pc8HG9x
Thank you for the contribution. It has been approved.
You can contact us on Discord.
[utopian-moderator]
thanks !
trippy.
:D