STEEM: 1-DAY MACD could be about to go green (soon!) on poloniex.
Hi folks,
I've found in the past that the 1-day MACD on poloniex turning green, can sometimes be a useful indicator for trading. But, unless you watch the charts every day, you might likely miss this event! Therefore, I just wanted to make a post about this, in case anyone is interested :)
Please note: I am not suggesting a correlation between this event and any price change, and I am not advising buying or selling based on this. Instead I'm only discussing some annotated charts, which may or may not be of interest to the reader.
First's let's look at the chart of STEEM on poloniex:
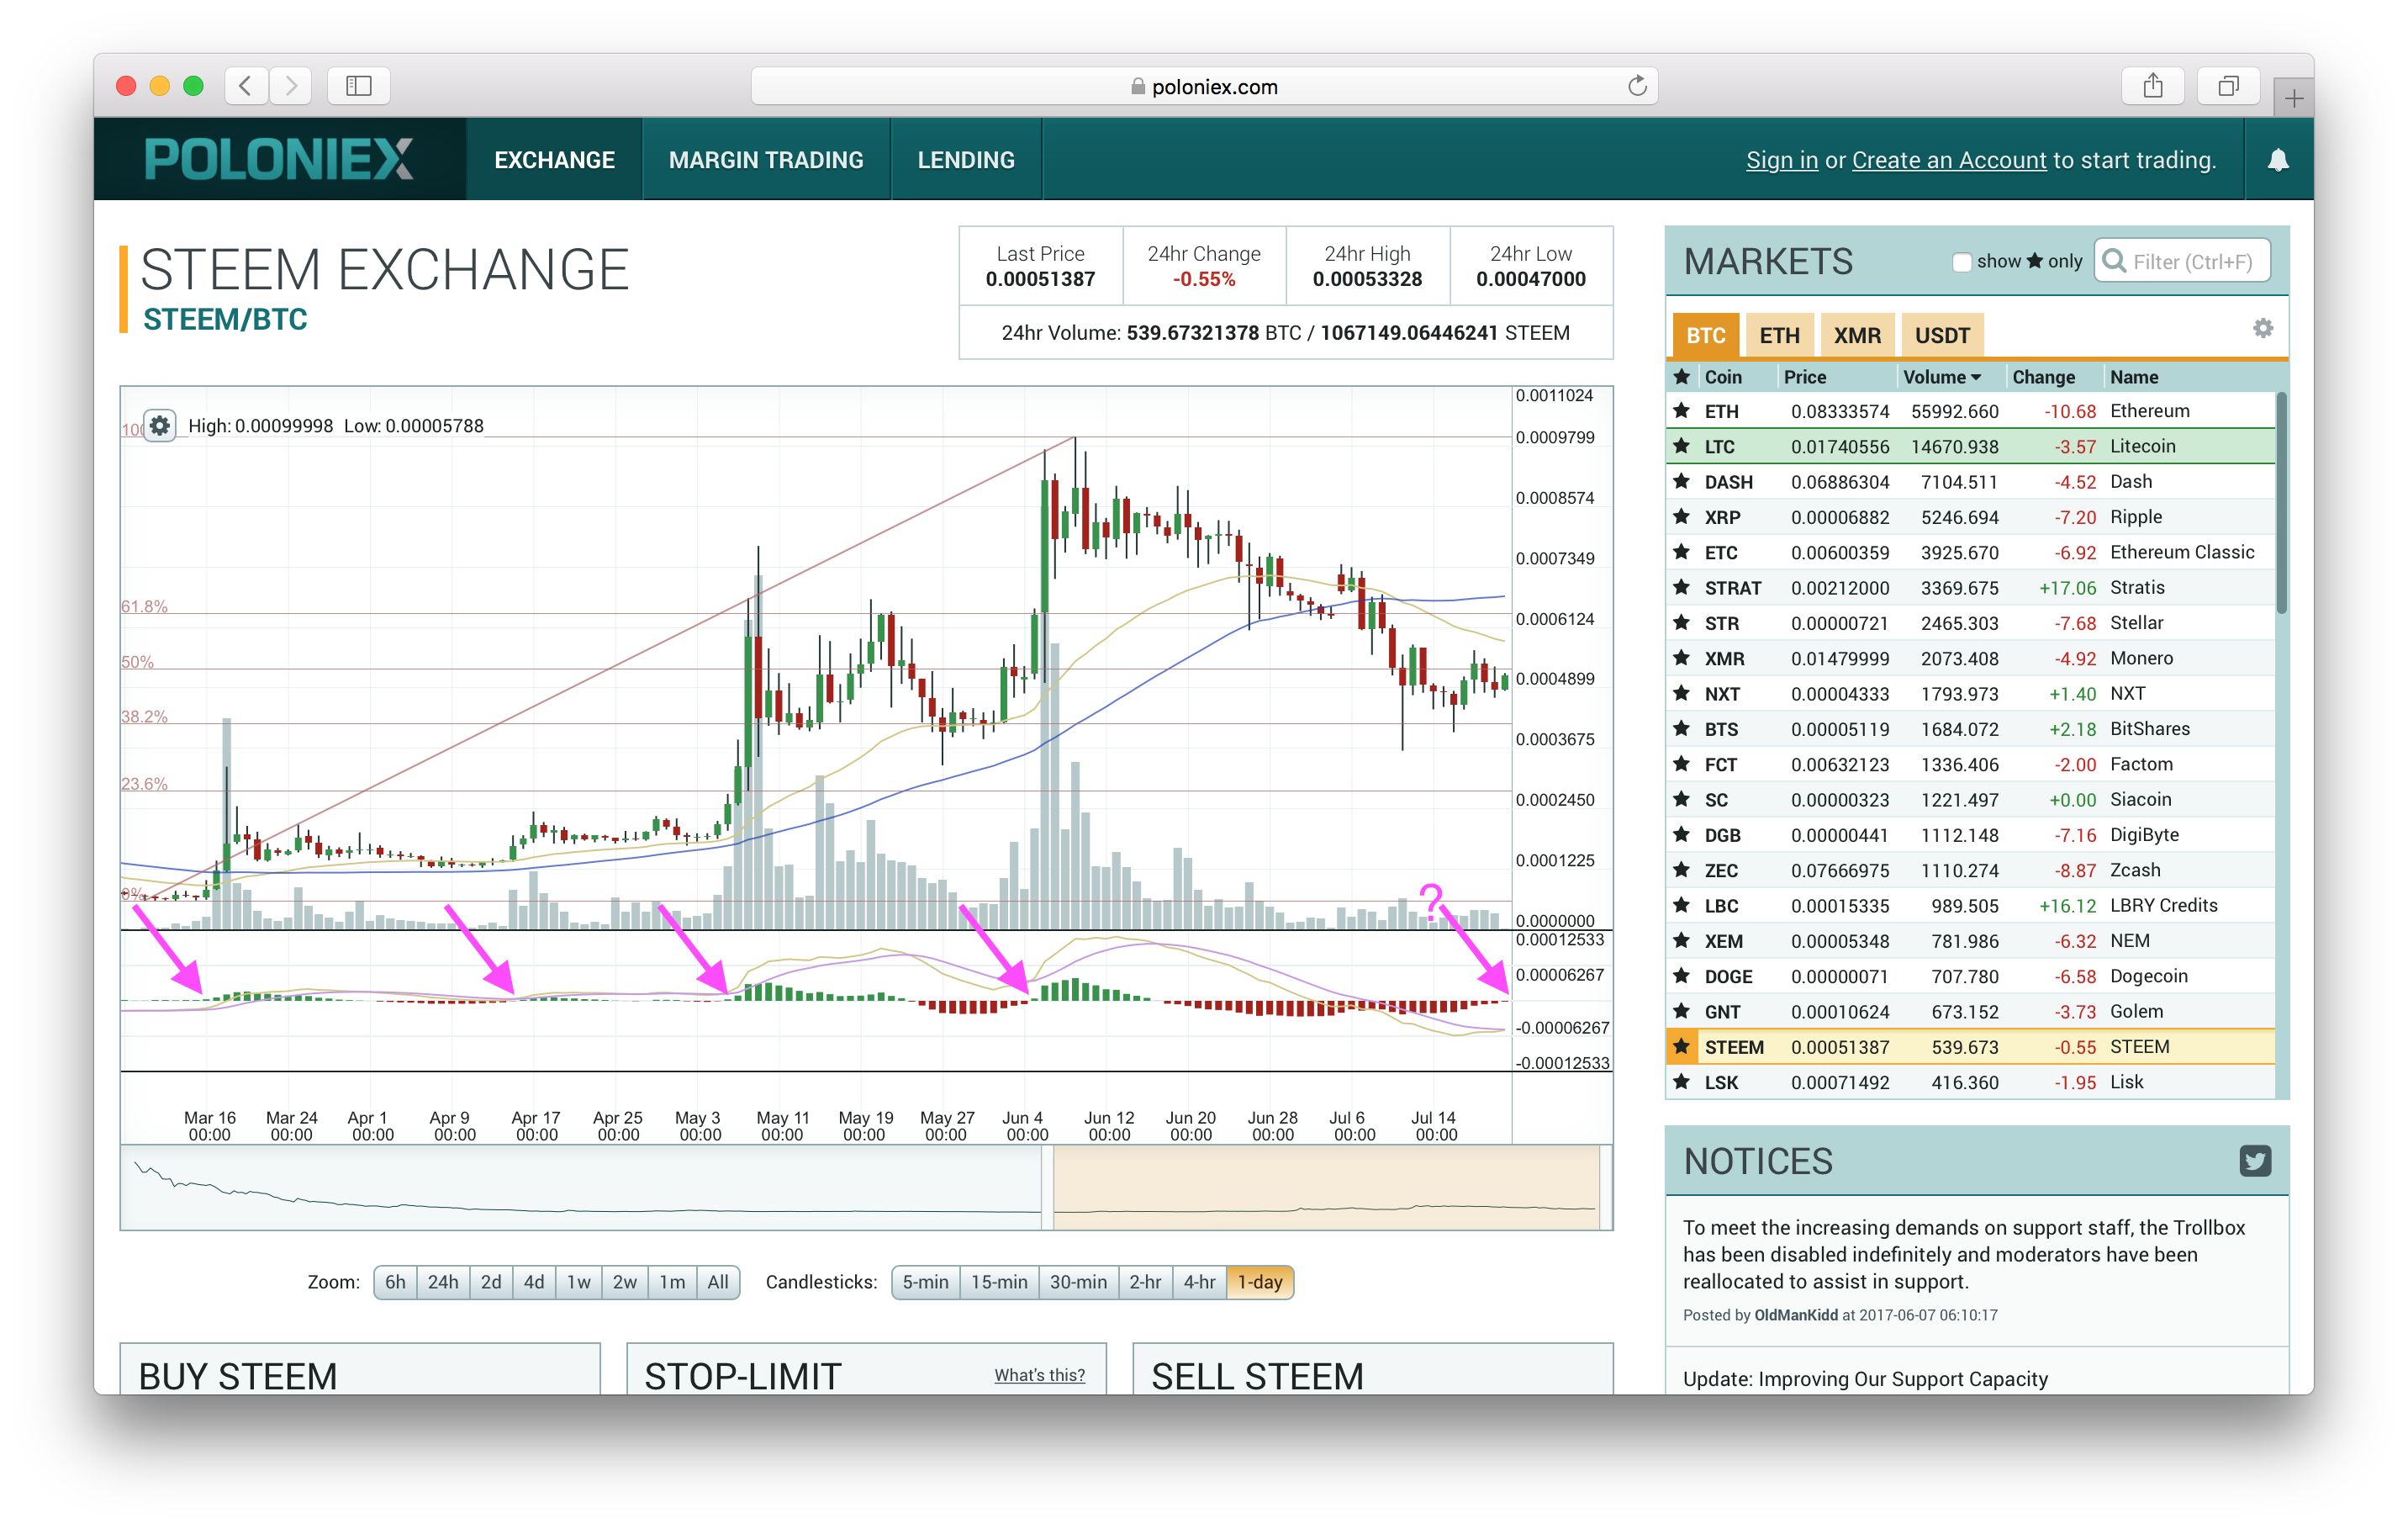
I've marked previous 1-day MACD red->green changes with magenta arrows, and I've put a question mark next to last one because it hasn't changed over yet.
Do you think there is any correlation between these arrows and price increases? And does another MACD red->green switch-over look likely to occur soon?
Out of interest, here's another current chart (Bitshares), for which I've added the same indicators:

The same questions arise: What's the likelihood of both a 1-day MACD red->green switch over occurring soon, and will we see a price increase (relative to BTC) too?
Also, this chart has a 'double bottom' formation, which is often regarded as an indictor that a reversal (price increase) may take place soon after.
Finally, here's one more current chart from poloniex (Stratis), which I've included because it shows a recent 1-day MACD red->green switch over.
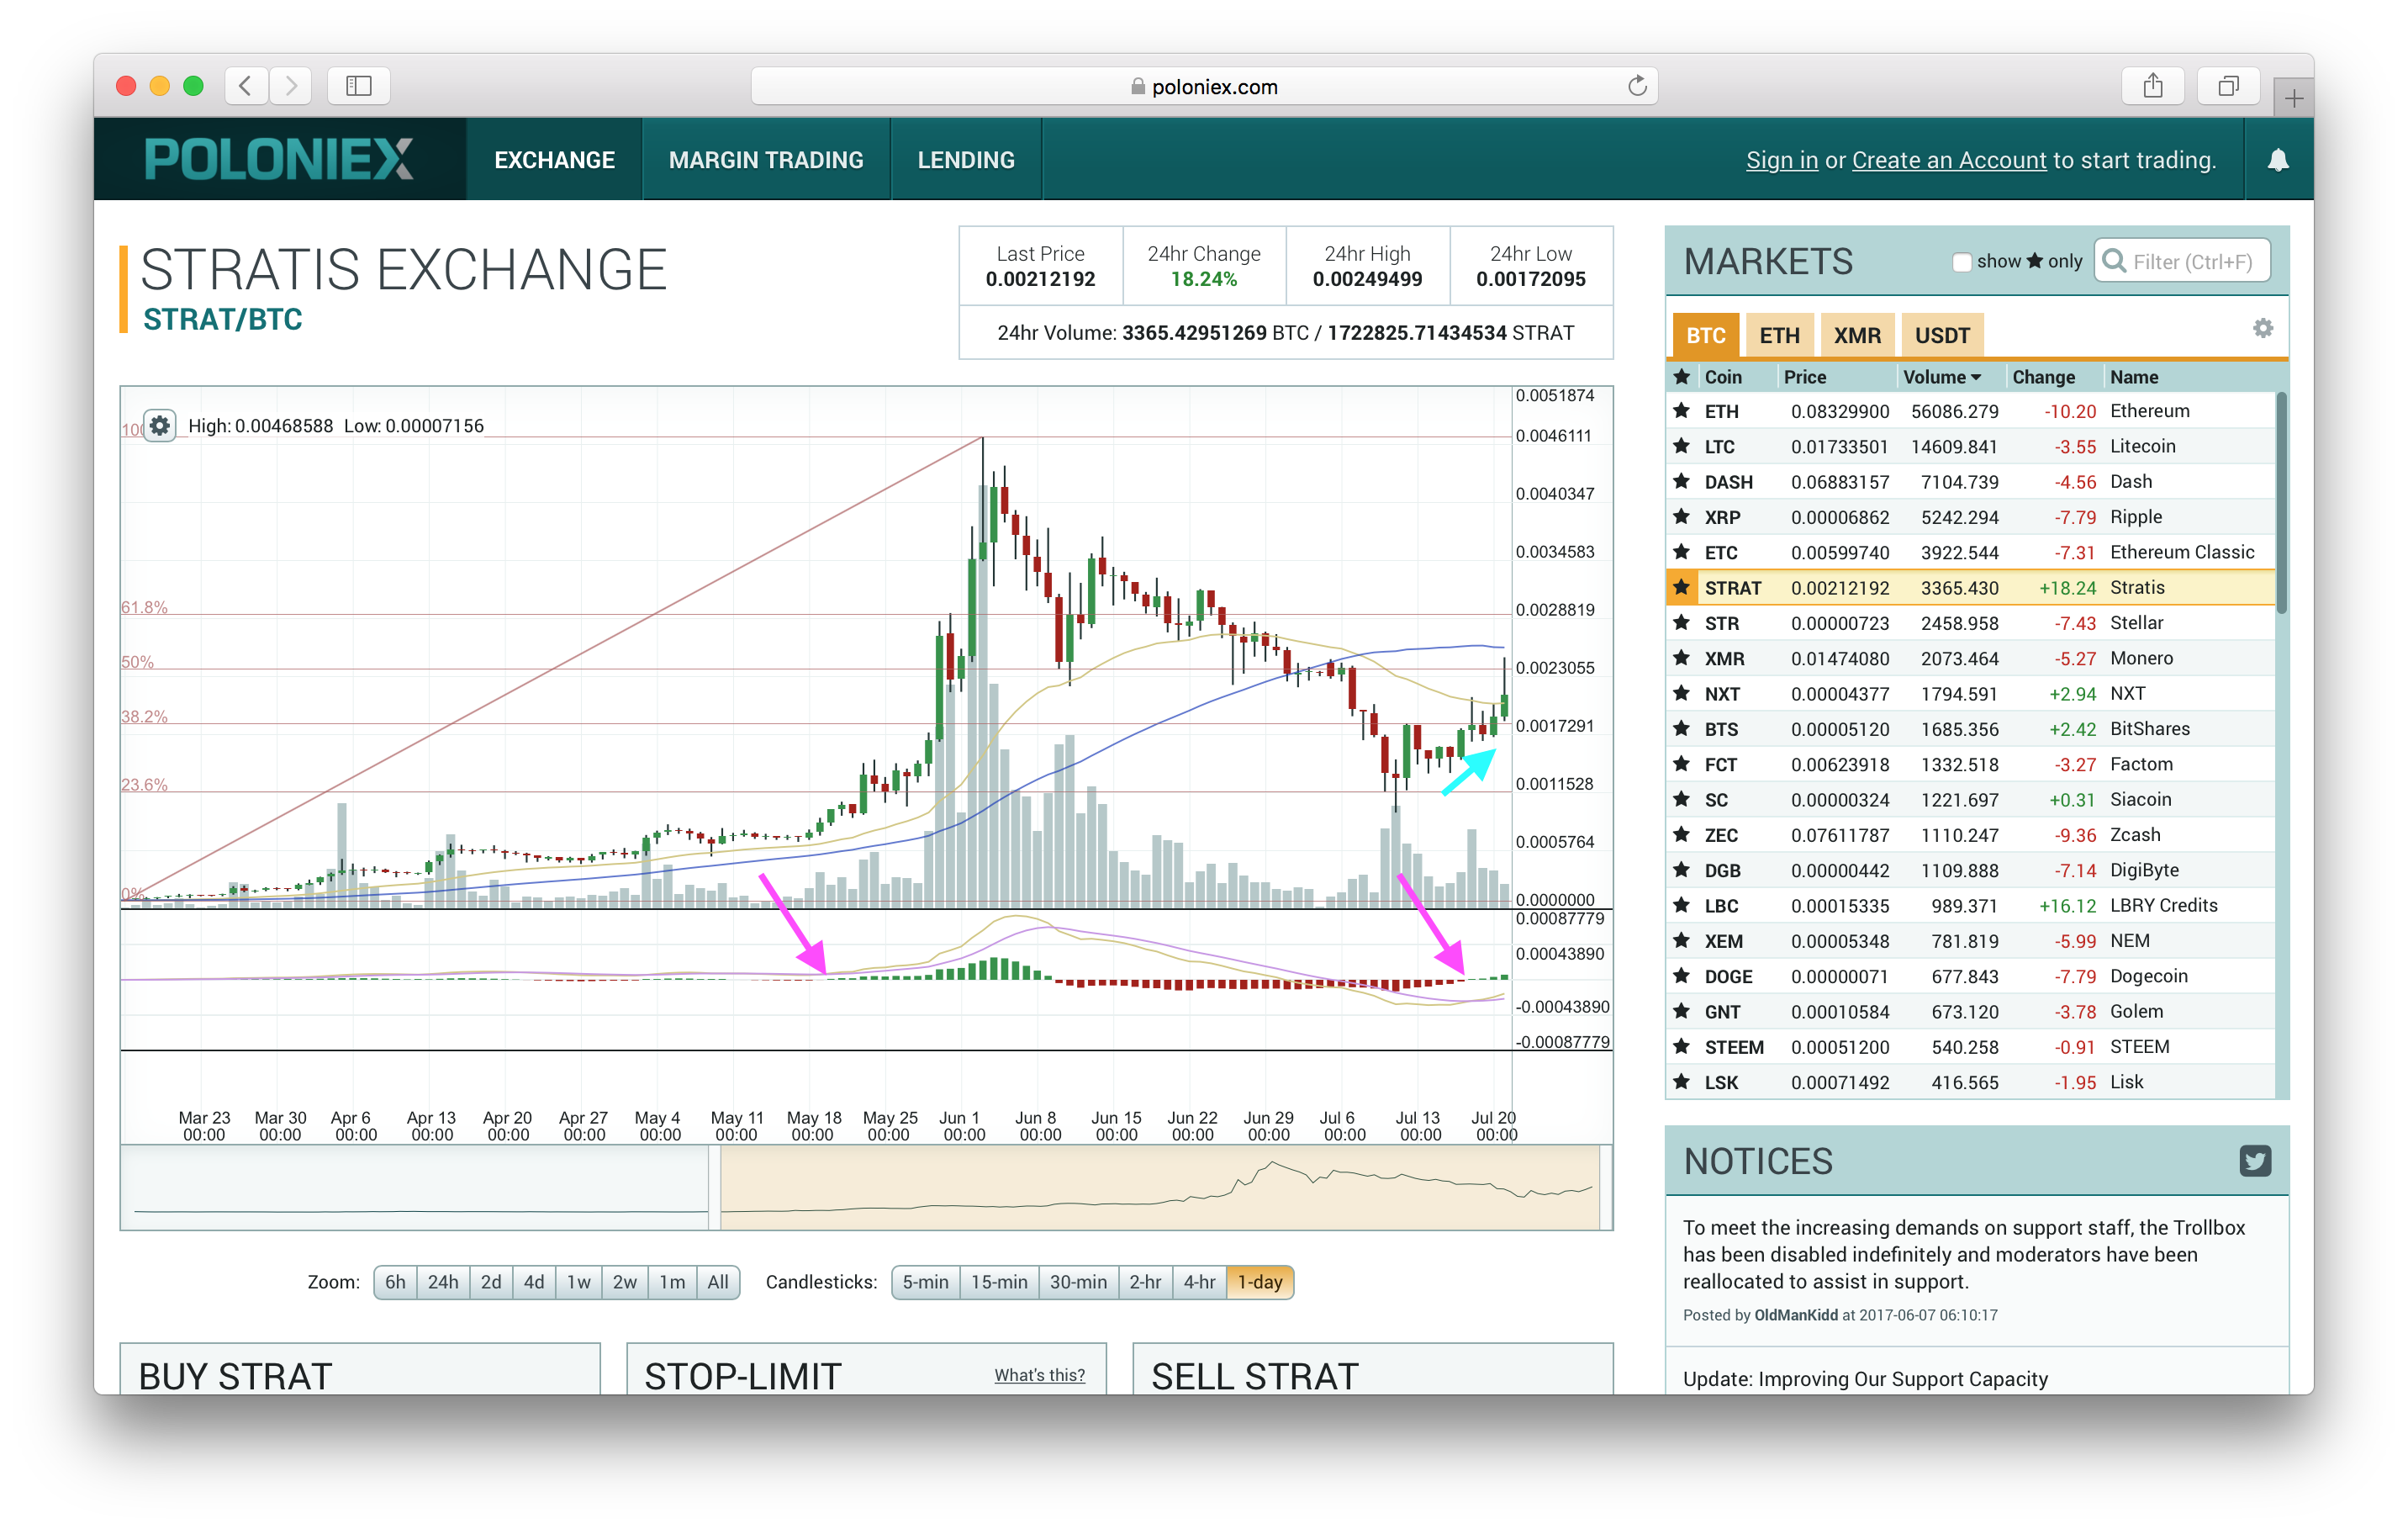
As we can see from this chart, there was a nice price increase (shown by the cyan arrow), which did coincide with a 1-day MACD switch over. But was this coincidence, or is there some other reason to explain it? (Personally, I think it's quite likely there could be an external reason - but as I'm not looking to trade it, I haven't looked into it!) However, even if an external reason was the cause of a large price increase, it might also likely cause the 1-day MACD to switch over too - since its data is directly derived from the price data!
One other thing that might lead me to believe that it could be less likely that we see large price increases in typical alt-coins, right this minute, is that we've just had a very substantial rebound in prices already (like was the case with STEEM, Bitshares & many other, today). And, this doesn't show up on the alt-vs-BTC charts, because BTC has just had a huge increase too (from its recent low).
This brings us to the question of whether we should even be using alt-coin against BTC charts for any technical analysis? Personally, I tend to avoid looking at these types of chart when I can avoid it (for the reason that BTC can be very unstable), and much prefer alt-coin-against-USD charts wherever possible. However, I still think alt-vs-BTC charts may be of some interest, especially for coins that are mainly traded against BTC (and STEEM is a good example of this). One main reason, I believe, is: if there are a lot of other traders out there making decisions based on the same alt-vs-BTC chart (and one example might be the 1-day MACD red->green switch over on poloniex), then I tend to think this in itself could be a cause of some price movements (whatever the technical merits of using the chart)!
Finally, here's a chart of STEEM against USD (taken from coinmarketcap):
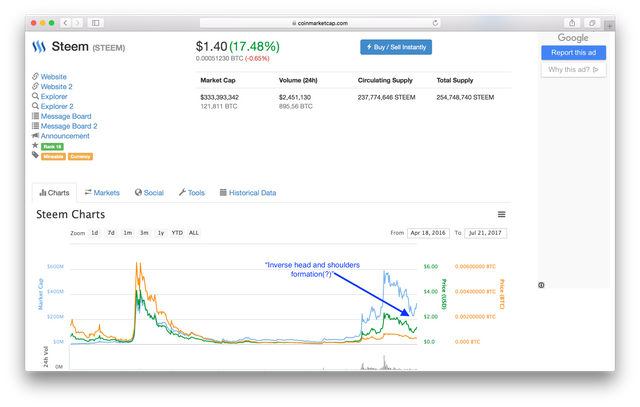
As we can from this chart, we've already had a substantial increase in the price of STEEM, over the last week: from around $0.90 at its low point to nearly $1.40 right now (so, around a 50% increase)!
This chart also looks to be showing a bit of an 'inverse head and shoulders formation'- which could be taken as a positive sign for the continuance of the rebound.
Anyway, whether you are trading or not, it may still be of interest to see what happens to these charts in the next few weeks. Will we see the 1-day MACD switch-over? Personally I might hazard a guess that this looks to me to be quite likely. But, will we see a substantial increase in STEEM when plotted against BTC? To me, this is a much trickier thing to predict, particularly in the case STEEM (or Bitshares) right now, because as I mentioned (1) BTC is very unstable, and (2) we've already had a 50% bounce back of STEEM when plotted against USD. But the reader must make up their own mind, of course!
Please let me know if you have any comments or views on this post. Thanks!
DISCLAIMER: Nothing in this post pertains to any trading advice.
Good analisys about crypto
@xaero1
Great pic...like it :D. Thanks!
Thankfull
@xaero
Great to have your work analysis again !!

Cool!!!thanks:D
Hahahaha... love it!😄
LOL! :]]] Oh wow... thanks for the upvote!
This is the Comment of they day hahah amazing
Thanks :P
It seems to me that you invested this week in the encrypted currencies, that's good, because it will increase the price. This is encouraging.

Yes, a good week for trading. Also a great week for anyone holding steem power. No idea where it will end up, but the higher the price the better it is to everyone - holders, and payout awards!😄
In other words, this upvote should be worth more today :)
Plus thanks for the gif!
Excellent analysis as usual! I bet you're glad you got that extra Steem Power when you did :) It's definitely hard to say what will happen to the price of steem, but my untechnical view is that it will slowly and surely incrementally increase in stages and then at certain junctions it will experience a steeper jump in value. What will be the catalyst to drive the next price leap? I'm not sure...maybe even more user growth?
My view is that one of the reasons why Bitcoin and a lot of the other cryptos are rebounding now is because there's good news with the whole Bitcoin SegWit thing.
I think overall there's still a bit of a bubble what with the ridiculous amount of new tokens/coins coming out every day now. I think there's a lot of good, viable protocols/apps/coins mixed in with the bad but right now everything in the space is on fire. This will flesh out at some point and many will fall but the substantive, useful ones will be really successful (I'm hoping I'm only betting on those). That's my two cents of where things stand anyways.
Haha...well I bought some steem power under $0.50, then some at over $2.00; then more in between (so I couldn't give an exact figure on my ave. buy in price).
As for STEEM, i have somewhat mixed expectations. I am fully committed I just worry a bit with new users giving up if they don't earn much...along with a bit of a possible tragedy of commons thing were steem power is concentrated too much, and not spread out enough...but this was a problem that's always been present due to the bad launch method. But let's see... I don't plan on selling any steem whatever!
As for crypto, news is not the only thing and certainly not the main thing that drives long term price imo .... instead, there are natural repeating cycles of hype. I have a feeling that this is dying down...but it's possible we could get another burst later in the year.
Thanks a lot for your comment 😀
A good view on Bitcoin and major altcoins for this month:
https://steemit.com/bitcoin/@az-charts/bitcoin-below-2500usd-and-it-s-crashing-needs-to-keep-up-the-pace-3300usd-early-target-or-monthly-weekly-daily-view-21-july-2017
https://steemit.com/ethereum/@az-charts/altcoins-eos-to-3usd-ltc-to-65usd-eth-to-290usd-zcash-to-320usd-dash-to-230usd-or-altcoins-monthly-weekly-daily-view-21-july
I learned that MACD studies different averages and their relationship in time. It's useful when measuring extremes because it has no limits, and it can be really useful when paired with an oscillator (e.g. RSI) to discover when a security is overbought or oversold.
Many use the MACD histogram as a momentum indicator which can also help you in deciding when to buy or sell. However, MACD is considered a lagging indicator so I try to look at other indicators too.
I'm no trading expert (currently teaching myself) and I encourage others to watch this video to learn more about it:
note: I'm in no way associated with Coinigy. I just find this video to be useful.
Cool! Thanks for your comment, and for posting that link!
Maybe I should be referring to MACD histogram rather than MACD... Anyway, whatever it should be called, it's what I use, along with EMA switch overs :)
But, yes , anything based on an average of recent prices will lag...but then that's the point. Either way, those are the two indicators I use. I've a heard a lot about RSI, but I can't ever say I have found it useful (although perhaps I didn't take time to try to understand it!)
I agree with your artickle
But i not have much money
@xaero
Very interesting!
Your technical analysis in the crypto market using my favorite indicator ( MACD ) is Really so good..
"This chart also looks to be showing a bit of an 'inverse head and shoulders formation'- which could be taken as a positive sign for the continuance of the rebound. "
I agree fully with you..
Keep the good work, Thanks for sharing..
If you have sometime please check this meme:
https://steemit.com/meme/@lordoftruth/he-she-they-and-angel-steem-let-us-drink-coffee-with-hot-steem
Wish you a great and sunny friday
Thanks very much & great to hear someone concurring with some of the stuff I was discussing😄
Jeez there looks like there is a strong correlation @xaero1
Looks like when there is red for the first time you can cash out if you want since it persists for a while then it flips to green then keeps alternating.
If this keeps going on you could probably manipulate the markets and earn some money if you know that it keeps alternating and there is no spontaneous events.
However, the crypto markets are unpredictable sometimes so let's see if this trend persists
Thanks a lot for your analysis and graph
The funny thing is whenever I think something's a dead cert, I will often lose money ;). But yeah, I'd say it looks like there a nice correlation, but perhaps that only worked well in the past when bitcoin was relatively stable. That's why I'm a bit dubious about using the STEEM/BTC chart, right now, given BTC's crazy spike in the last week. But I'm still interested to be see how the charts have panned out in a couple of weeks time :D
TA should not be used as evidence of absence especially in absence of evidence. Glad to see you highlighted points to why this would be happening too.
Thanks! (I need to read your first sentence over a couple of times in order to processes it, though!!😄)