Do you really understand probabilities? Knowing your Probabilities is your golden ticket to trading.
I used to manage a retail store with over 35 employees. The store was maybe 28,000 square feet, and we would normally sell anywhere from $10,000-$35,000 of merchandise a day. There were numbers I would go over in the office each week that would boggle my mind. Each day we would pass 800 or so customers through the cash and our city had a population of 140,000 (but there were near by citys with larger populations also). Still, somehow we would get 500 to 800 customers a day. Here is the crazy thing, each day of the week repeated sales numbers.. Like, you might sell $6,000 on a monday, $10,000 on a tuesday, $12,000 on a weds, $8,000 on a thurday, $15,000 on a friday, $18,000 on saturday, $13,000 on sunday. But the following week it would all repeat again! Yet the customers were mostly all different. If you were to go up to random people on the street and ask how often to you visit my store, they would likely say once or twice a month. So how is it that we would get similar sales numbers every week day, over and over, with different people buying different stuff??? That's where probabilities come into play.. Even though individually, each person in a population of 140,000 chose when they wanted to visit my store, as a percentage a certain amount of people would decide "today is the day I want to go shop". And in 140,000 people, somewhere between 500 and 800 customers would come in each day. This provided me with near to the same sales each week, over and over. It was really hard for me to wrap my head around the reliability of probabilities. But after a few years managing that store, I was a believer in the consistent numbers.
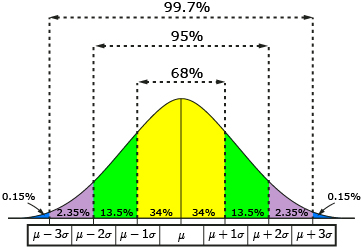
Now in Probabilities there is something called a bell curve.
A Bell curve is a general term that's used to describe a graphical depiction of a normal probability distribution. Basically its a graph that looks like a bell and it displays that the most probably event in a series of data will be at the top of the curve, while the less likely events will fall further and further out at the extremes. Now there is a lot more technical stuff to bell curves like calculating standard deviations and whatnot but lets keep it simple. So in the example of my store, there would eventually be a day where we only get a few customers and sell maybe $500 of product (during a snow storm perhaps), but on the other side of the bell curve there would also be a day where we have blowout sales and sell $60,000 of product (maybe around Christmas). But most days would have normal sales of around $10,000.
So what does this have to do with trading?
Well everything in trading is probabilities. For instance I win 95-98% of all my trades. That seems outragous to some traders, but thats reality for me. That means that with 251 trading days in 2017, I can expect to have 5-12 red days and 239-246 green ones. That also means that if i on average make $300-$500 a trade, then I can expect one or two to lose me near $2,000 and on the other side of the bell curve I can expect some to win $10,000 or more. (I actually have never lost more than $200 in cryptos, and have made some enormous wins.. but cryptos is a very very easy market to trade)
But wait a minute, maybe I'm just getting lucky. How can I expect to keep winning 95-98% of all my trades, year in and year out? Can I foretell the future?
I can keep doing this because I know how to read a chart. And how I read charts is not the same as most traders. To me charts are visual representations of probabilities. Other traders learn Technical Analysis and use the same indicators on every chart to guide their buy and sell decisions. But every chart can be different, and can behave differently. Every chart tells you a different story, so you can't use TA from one chart on another chart, unless you examine all historical periods to see it that TA is relevant for that particular coin. When I look at a chart I am looking for repeatable patterns on that specific chart and I wont take a trade unless there is enough repeats of the pattern I have observed to calculate a probability. The strategy will be different on different charts, because the patterns will be different. But charts allow you to see those patterns and to calculate odds. After you understand your odds, it is very difficult to lose a trade.
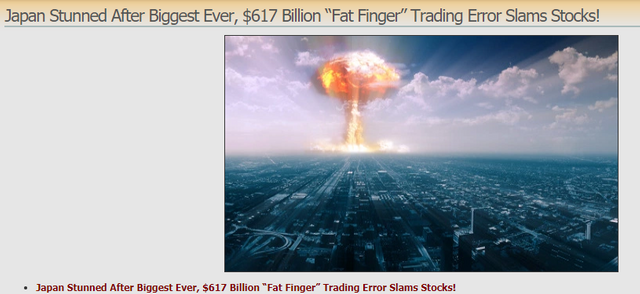
In my videos I have labeled some of my trades as Position trades or Small Account Building Trades, or Fat Finger Daytrades, or Pullback Daytrades. I labeled these different types of trades to help newer traders get a feel for what is the common high probability set ups in this market. But again every chart is not the same, and you must learn to read the story of the chart, so you know your odds before you take a trade. You don't want to take trades just because a certain set up was successful on other charts in the past, please look at each chart on its own and read the full story of the chart you are planning to trade. After you a while this will become second nature, and it will only take you seconds to disqualify all the bad trades, leaving you with only the very best and highest odds of winning every trade.
Sometimes I go weeks without losing one trade. Again that's not because I can predict the future, its because no one is forcing me to take a trade, so unless I can read the context of a chart and understand my odds, I don't buy. Don't feel like you need to put on a trade this minute, or hour, or even today. There is always another awesome trade right around the corner, and it pays to wait for it and meanwhile develop your skills at reading your probabilities on every chart.
Luc
Love your work keep it up. I've learned so much form you. Best classroom ever 🤙👌
The crypto market is easy to trade because it is a bull market. Remember, if you are inside a growing market, you grow with it, and that allows for such a number of successful and profitable trades. Crypto will continue to go up for many years, enabling us to profit from it if we implement smart investing principles.
Thank you for the article, I would appreciate if you could reflect on my post about bitcoin price history. Thanks :)
https://steemit.com/ante/@botixx/part-one-in-which-we-find-the-price-history-of-bitcoin-could-predict-the-next-big-crash
The crypto market is also easy to trade because there aren't that many Lucs out there. There aren't skyscrapers full of analysts working 80 hour weeks out-competing others.
Ha, ^This. Yup
First to comment too...
Just wanted to say thanks for all the great work...
Thank you Great Luc!!!
Thank you for your vote.. much appreciated..
Great post Luc. I think inside here is the whole key to your strategy: reading, as you call it, the "story of the chart." That's where so many of us on the slack are stumbling I think. That grasp of context behind probability is so important, yet many just kind of stumble into some excitement and buy without looking.
My question on that is this: do you tend to trade within charts you've studied in depth and have a working knowlege of the "story" of? Or do you often wing it on the fly when the scanner calls? Would really love to see more on this.
As always, thanks so much for all you do for us fledgling traders!
Great job. For the same reason I came to conclusion that we lived million lives on billions of earth like planets.
Thanks for your continued help. The world definately needs more people like you!!
Thank you for getting this out. @quickfingersluc
Woke up... New Luc post! And my day has just begun ;)
Thanks for the nice work @ quickfingersluc!
You're a very smart man, Mr. Luc. Really can't thank you enough for everything you do for this community. Hopefully one day I can be half the trader you are and give a little back too.