Technical analysis Bitcoin BTC/USD - 01.10.2017
The BTC course broke the top of the downward trend in which it moved since the beginning of the month. This was caused by a series of negative news appearing this month. Full comment to summarize the last month on the cryptocurrencies market can be found (here - https://bithub.pl/analizy/ranking-kryptowalut-wrzesien-2017/). Breaking up from the channel gives us a signal to look for long positions. At the moment we see the price rebound from the resistance marked with the red rectangle on the chart. Based on adjustments equality you can designate a potential place where the price may drop. We see that this place occurs in the same place as the designated support (green area).
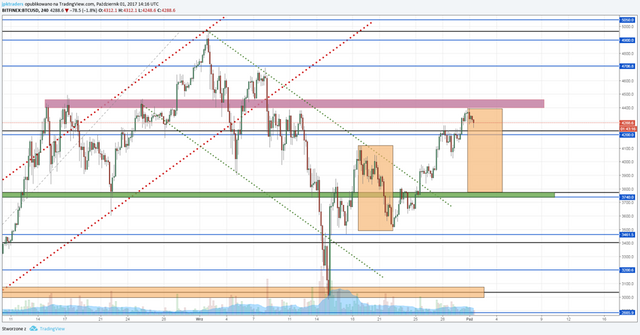
Market scenarios for the coming days can be found below. Buy after correction on green support and alternatively, if the correction wasn't deep enough, buy after the break of resistance and his test from above.
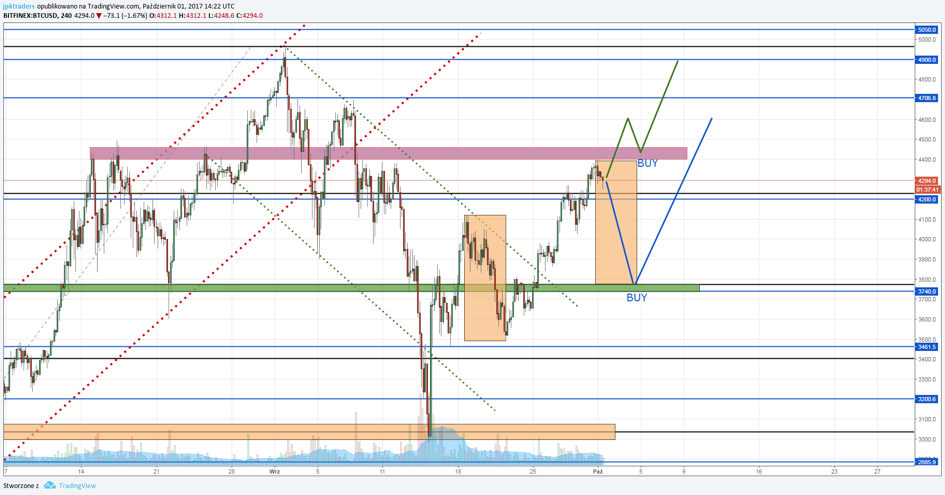
Seems like the market has chosen the $3800 way