Trading the Parabolic Curve Pattern
BY DANKRA ON JUNE 3, 2014, 8:12:BST CHARTS AND PATTERNS
In today’s article, we are going to talk about the parabolic curve pattern. This pattern is one of the commonly occurring but least recognized patterns in the forex market. Due to its predictability, it is a good pattern that traders can profit with, and that is why we are introducing it on this blog for the first time ever.
The Parabolic Curve derives its name from the parabola, because the line that is used to trace out this pattern from the candlestick price action resembles a parabola. The parabolic curve is one of those patterns which can give the discerning trader some unbelievable returns within the shortest possible time. As a rule, traders will find that the trading opportunity of the parabolic curves patterns tend to occur at or near the end of a major market advance. The pattern usually forms as the result of multiple base formation breaks. The price action that usually yields the parabolic curve often resembles a staircase, with the price action eventually ending in a downward spiral of prices that follow the steepest price advance in the curve.
Appearance
How does a parabolic curve pattern look like? The parabolic curve pattern is a curved trend line which cannot be said to be an arc, or an elliptical shape. Rather, it looks more like a skewed parabola, and the resultant shape of the curve is more of a a proprietary calculation. Some automated tools exist which can be applied to the charts to draw parabolic curves automatically wherever they occur. One of such tools is the GTE parabolic tool, provided by GuppyTraders Essentials Toolbox. We see a diagrammatic representation of the parabolic curve pattern displayed here:
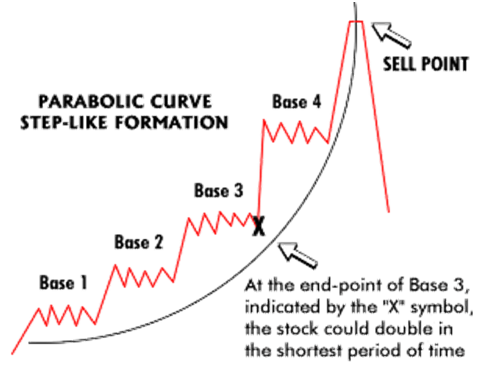
This is how a parabolic curve pattern looks like on a live chart pulled from the MT4 platform:
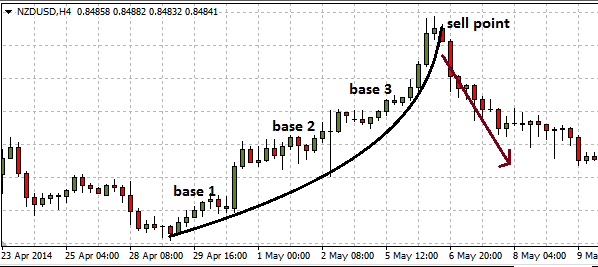
This is a 4 hour chart of the NZDUSD showing the typical parabolic curve formation. In the latter parts of this article, we shall discuss the formation of the parabolic curve pattern as well as the methodology of trading this pattern.
History and Application
This parabolic curve pattern was first observed in the markets over 50 years ago and was misnamed a parabolic trend. Then, observing a parabolic curve pattern on the charts was a rarity. With increased market participation in forex, with the added propensity to have increased buying and selling pressure on a currency pair by an increased number of market players, it is now a much more frequently seen pattern. The parabolic curve pattern is used to define fast moving trend acceleration, as the steepness of the curve increases with time. These fast price rise is usually a sign of either panic buying or herd buying, driving prices to unsustainable levels before the inevitable rapid collapse. A characteristic of these trends is the rapid collapse when prices move to the right of the trend line that forms the parabola curve. This trend line thus has a defined end date. These trends occur in all types of stocks. These trends may also constitute an additional development in an existing trend.
Trading the Parabolic Curve Pattern
There are two approaches to trading the parabolic curve pattern. You may decide to use long trades at the areas where the base points meet the parabola and bounce off it, or you may decide to wait until the buying party is over, and sell as the price action shifts to the right of the curve. Usually, the second option produces more reliable and sustainable results than the first one.
a) Long Trades
A stock moves parabolic at the end of extreme uptrends, and this pattern is seen when panic buying sets in and prices are driven almost to a vertical point. During a parabolic uptrend, there is a near-complete absence of sellers, which creates a vacuum that permits nothing else but buying activity. As prices rise, more buyers flock in. Fear is conveniently left behind as more traders rush into the trend just to get a piece of the action regardless of price. Moves that occur in parabolic fashion can make the largest price moves in the shortest amount of time, but are very dangerous places to enter long positions when the party is about to come to an end. When an asset moves parabolic, it often marks the end of a move with prices not returning to the ultimate highs again for a long time.
We see this pattern in the chart shown earlier in this article where the NZDUSD went parabolic and gained in volume and price at the end of the run. What began as an uptrend quickly became panic buying, driving the currency pair vertically higher. This is the accelerated growth phase.
After which the asset breaks out from a long basing pattern, it will sometimes enter a rapid growth phase with a series of ever-steepening, rising trend lines. Often the acceleration of price appears as a parabolic curve on the price chart, and sometimes the final stages of the move will climax with a leg that is virtually straight up.
The emphasis of the long trades would be to:
Identify the base points as shown on the chart.
Locate the areas where the base points make a run to the parabolic curve.
Buy at those points with a very short stay in view.
Due to the extremely short term nature of the long trades occasioned by the increasing steepness of the parabolic curve, it is essential that the trader has a clearly defined exit strategy for such trades.
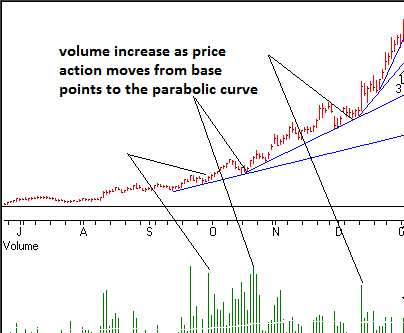
The base points are areas where there seems to be a lull in activity, which pushes prices almost sideways to the parabolic curve from where a renewed round of buying takes place. Usually the trade volumes at these buy areas rise very rapidly, and can be detected by the use of the volume indicator. These are the areas at which traders should setup their long trades, as can be seen on this chart below:
When an active long trade is on, the trade must be monitored very closely. As the development of the curve progresses, aim to exit on the next base point above touching the parabolic curve. As the trend approaches the end date, exit on any intraday move below the trend line. Preferably, you should even exit any active long trade just prior to the inevitable move to the right of the trend line, when it is noticed that the parabolic curve is already at the vertical point.
Use the value of the trend line as a stop loss. It is obvious from the formation that the stop loss is not going to be a stationary one, but will have to move as price advances.
b) Short Trades
This is the more assured and safer play of the two trade positions. Parabolic curves will almost always get to a point of price collapse. Sometimes there is a bit of topping followed by a controlled, but precipitous decline, but other times the straight up move reverses into a straight down move of equal or perhaps even greater magnitude. It may be the effect of gravity, but the collapse will almost always outweigh whatever short burst of upside moves that would have previously occurred.
Once the parabolic has broken down, prices will sometimes return to the level where the parabolic rise began. This is most common with movements that can be attributed more to hype than on actual substance based on genuine market fundamentals. Another possible outcome is that the currency pair could lose a substantial amount of its gain, then enter a period of high-level consolidation. This is what appears to be happening with our NZDUSD chart above, as you can notice the leveling out of the downside move.
Trading the price collapse should be really easy. All the trader needs to wait for, is for price to break through the already vertically inclined part of the parabolic curve, accompanied by a rise in volume. This almost always confirms that the upside party is over and the downside ready to begin. We have treated the issue of how to spot and confirm a breakout in so many places on this blog that it will receive a brief mention here. The price action candle simply has to close below the curve for the short trade to be confirmed.
Rules For Tracing The Parabolic Curve
This pattern is traded without reference to any other indicator. It is a standalone indicator. Once the price action has broken through the right of the trend line signal, this can be considered a good place to setup a short trade. To be genuinely counted as a parabolic curve, the trend line which forms the parabolic curve must hit at least 2 points. Preferably, this trend line should be allowed to touch 3 initial low points to form a valid trend line plot. Once the trend line has been plotted across three candlestick low points, the position of the curve does not change. In the real world of trading, it is more practical for the curve to start from a point of ‘best fit’, rather than necessarily starting at the commencement of the trend.
When the curve assumes a more vertical orientation, it sets the tone on which the next price bar will inevitably move to the right of the trend line, setting up the sell signal for the currency pair.
Advantages of Using the Parabolic Curve Pattern
What are the advantages of using the parabolic trend in trading forex?
It is suitable in capturing moves that evolve very fast, especially in situations where mass panic buying causes prices to rise very steeply.
It can be used to identify accelerating trends.
It gives very precise entry and exit points, depending on how the parabolic curve is traded.
It provides opportunities for buyers and sellers alike. Those who miss out on the opportunity to buy off the curve at the various base points, can simply wait to capitalize on the collapse of prices that follow the shift of price action to the right of the curve.
The parabolic curve can be most effectively used with price or derivative leverages.
Disadvantages of the Parabolic Curve Pattern
There are also some disadvantages to using the parabolic trend:
If you are a buyer and you get in late when prices have risen so steeply that the curve is almost vertical, then you need to be wary of the price collapse that is sure to follow.
It is usually difficult to identify this pattern in the early stages of trend development. By the time it is recognized, the initial trend may have been too far gone to assume a long trade off the bounce on the curve.
Conclusion
As with all other trade strategies discussed in this blog, you need to practice the recognition and use of the parabolic curve pattern on a virtual money account before attempting to take the strategy to a real money account. You can also search for tools which will help you spot the parabolic curve patterns in good time.