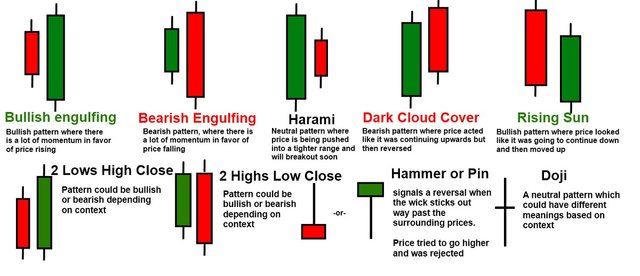
What is the Candlestick Patterns #1

A candlestick chart (also called Japanese candlestick chart) is a style of financial chart used to describe price movements of a security, derivative, or currency.
It is like a combination of line-chart and a bar-chart: Each bar represents all four important pieces of information: The open, the close, the high and the low. Being densely packed with information.
But i did not get the informtion from yor site cheetah
There are hundreds of pattern and yet none of them predict absolutely nothing most of the times. Is way more valuable to analyze volume by itself.